Figures & data
Table 1. Primer sequences for DNA sequencing, break point analysis, gap-PCR, and CNV analysis.
Table 2. TaqMan® assays were used for CNV analysis for the α-globin gene cluster and flanking regions.
Table 3. Hematological, biochemical, and molecular data of the patients studied.
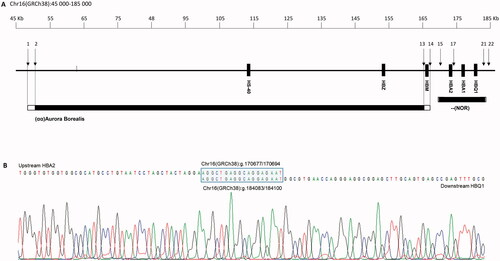
Figure 1. (A) Schematic representation of the small deletions found in HBA2 (NM_000517.4). Solid boxes denote the exons, solid black lines introns and hatched boxes represent the 5′ and the 3′ untranslated regions. The arrows show the location of the two small deletions found in exon 2 and exon 3 of HBA2. (B) Sequencing of the HBA2 gene showing a deletion of a single nt in exon 3 causing a frameshift and a PTC in codon 132. (C) A 20 nt deletion in exon 2 produces a new reading frame starting at codon 47 and ends in a PTC three positions downstream.
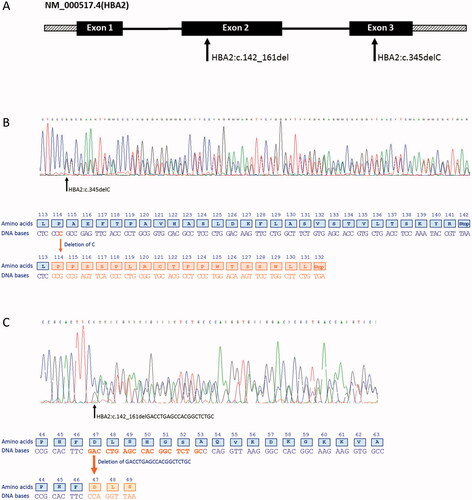
Figure 2. (A) Schematic representation of part of 16p13.3 showing a 190 kb region containing the α-globin gene cluster and flanking regions. The solid boxes denote the α-globin like genes and the regulatory region (HS-40). Black bars show the two deletions, –(NOR) and (αα)Aurora Borealis. The open ends indicate the region where the breakpoint is located. Black arrows and numbers indicate the location of the probes. (B) Characterization of breakpoints by gap-PCR and direct sequencing of –(NOR) showed that the deletion starts upstream of HBA2 at position 170677/170694 and ends at position 184083/184100, downstream of HBQ1. The blue box is the 18 nt homologous sequence where the homologous recombination event occurs.