Figures & data
Figure 1. A schematical view of the tissue specific processing of the proglucagon molecule with a focus on glucagon and epitopes used for its measurements. The arrows reflect antibodies. The red antibody reflects an N-terminal specific antibody (NH2), the black a side-viewing antibody and the blue a C-terminal specific antibody (COOH). If one is using an assay that uses either an N-terminal antibody or side-viewing antibody the assay will also measure oxyntomodulin and for the side viewing antibody glicentin. An accurate glucagon assay must therefore include both N-terminal and C-terminal specific antibodies. Intervening peptide 1(IP-1) and 2 (IP-2). Glicentin-related polypeptide (GRPP). Glucagon-like peptide-1 (GLP-1) and 2 (GLP-2).
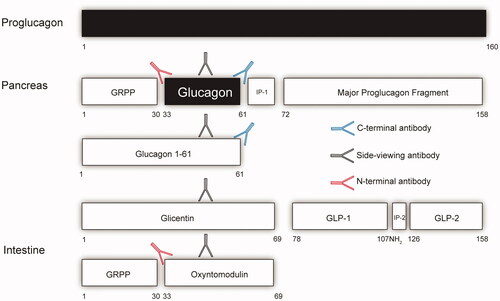
Figure 2. Endogenous and exogenous glucagon levels in healthy individuals. Plasma concentrations of glucagon are shown for three healthy individuals during an amino acid infusion (0–30 min) followed by a bolus infusion of glucagon (time 60 min). (A) Glucagon data (mean ± SD) obtained using two different wash protocols are shown (the simultaneous: black; the sequential: red). Individual data points (P1, P2, and P3) are shown in (B) (simultaneous) and (C) (sequential).
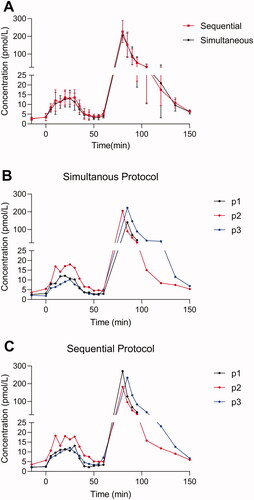
Figure 3. Endogenous glucagon levels in eight individuals with obesity (A) and for 10 RYGB operated individuals (B) during a protein rich meal. Glucagon data obtained using two different wash protocols are shown (the simultaneous: black; the sequential: red). Data shown as mean ± SD.
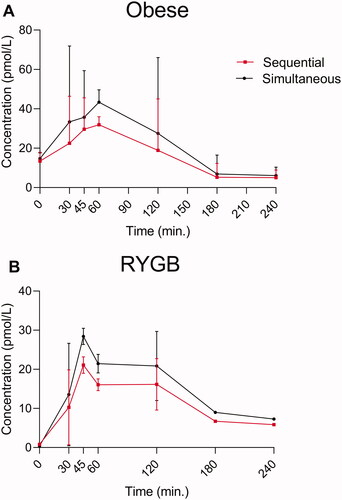
Figure 4. Endogenous glucagon levels in eight individuals with obesity (A) and for 10 RYGB operated individuals (B) during a pure glucose meal. Glucagon data obtained using two different wash protocols are shown (the simultaneous: black; the sequential: red). Data shown as mean ± SD.
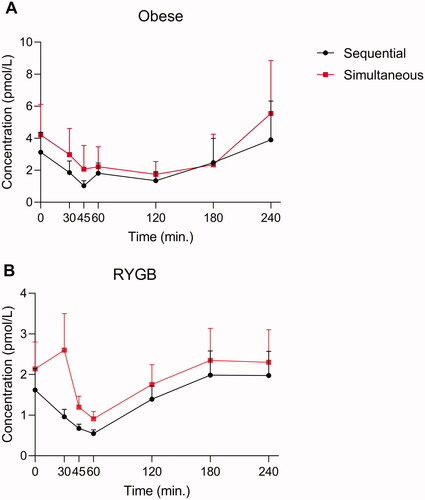
Figure 5. Endogenous glucagon levels in ten obese RYGB operated individuals during a 50 OGTT. Glucagon data obtained using two different wash protocols are shown (the simultaneous: black; the sequential: red) in (A). Plasma concentrations of oxyntomodulin (B) and glicentin (C) are shown. Based on glicentin data (C) we calculated and plotted the predictive secretory response assuming cross reactivity to glicentin of 5% (black square, dashed line), 10% (black triangle, dashed line) and 20% (black, dashed line) when using the simultaneous protocol (black circle, full line). Data shown as mean ± SD.
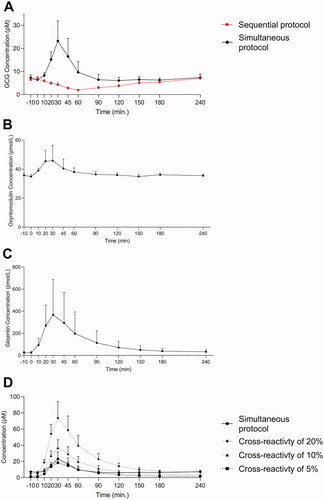
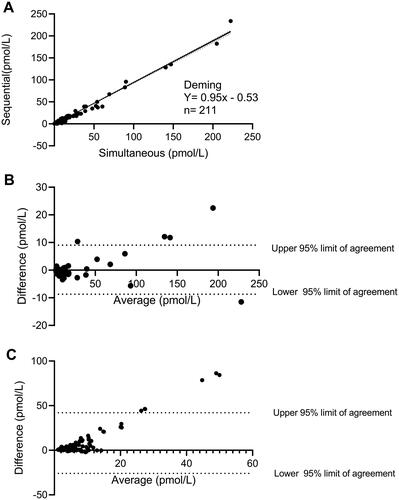
Figure 6. (A) A deming plot and related regression is shown for data obtained using the simultaneous and the sequential washing protocol in study A. The N here represent the number of technical and not biological replicates. Bland–Altman analyses for data obtained using the two washing protocols are illustrated in (B) (healthy individuals only) and (C) (RYGB operated, during the OGTTs). The Bland–Altman analyses are calculated as the subtraction between the simultaneous to the sequential in pmol/L. A positive value shown in these plots therefore represents higher plasma glucagon levels observed in the simultaneous as compared to the sequential protocol.