Figures & data
Figure 1. Proportion of NAFLD in each telomere tertile. Tertile one represents the shortest telomeres and tertile three the longest telomeres. The unadjusted univariate analysis of proportion of NAFLD in each tertile showed statistically significant difference when comparing the shortest telomere tertile against other tertiles. Reference category was selected to be the tertile with longer telomeres. Multivariate model adjusting for age, sex, BMI, CHD, LDL, HOMA-IR and TM6SF2 as follows: Tertile 1 vs. 3: p = .007 HR 2.03 (95% CI 1.22–3.38); Tertile 1 vs. 2: p = .006 HR 1.98 (95% CI 1.22–3.23); Tertile 2 vs. 3: p = .636 HR 1.13 (95% CI 0.68–1.87). CI: confidence interval; BMI: body mass index; CHD: coronary heart disease; LDL: low-density lipoproteins; HOMA-IR: homeostatic model of assessment of insulin resistance; TM6SF2: transmembrane 6 superfamily member 2.
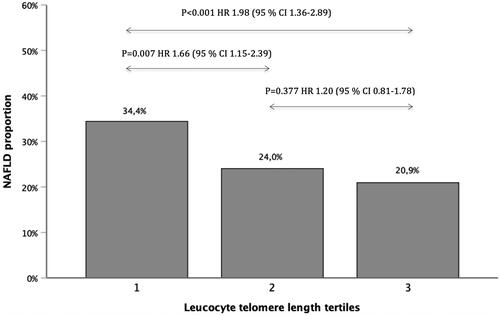
Table 1. Characteristics of the study population according to telomere length.
Table 2. Cox regression analysis for the hazard of death for the whole study group.
Table 3. Cox regression analysis for hazard of death in non-NAFLD and NAFLD subjects.
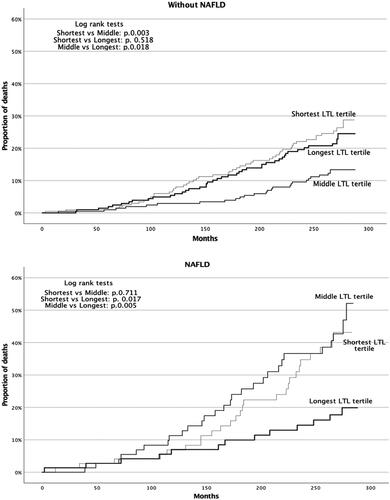
Figure 2. Kaplan–Meier plot for hazard of death according to telomere tertiles in both NAFLD and non-NAFLD populations. For NAFLD the risk of death was statistically lower in the longest segment whereas of non-NAFLD the middle segment was of lowest risk. NAFLD: nonalcoholic fatty liver disease.