
Figures & data
Figure 1. B-neutrophils (y) and b-calprotectin (x) in 124 routine EDTA blood samples. Both axes are logarithmic. The lower limit of the measuring range of b-calprotectin is indicated by a black vertical line.
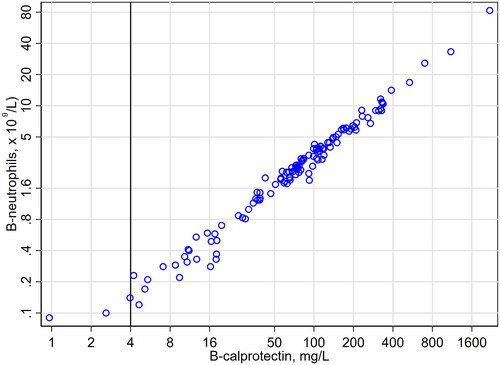
Figure 2. B-neutrophils (y) and b-calprotectin (x) in 36 routine EDTA blood samples with b-neutrophil <1.5 × 10⁹/L. The regression line and the 99% prediction interval is calculated from the 33 data pairs with b-calprotectin > 4 mg/L (lower limit of the measuring range [black vertical line]). The limit of b-neutrophil equal to 1.0 × 10⁹/L is indicated by a red horizontal line.
![Figure 2. B-neutrophils (y) and b-calprotectin (x) in 36 routine EDTA blood samples with b-neutrophil <1.5 × 10⁹/L. The regression line and the 99% prediction interval is calculated from the 33 data pairs with b-calprotectin > 4 mg/L (lower limit of the measuring range [black vertical line]). The limit of b-neutrophil equal to 1.0 × 10⁹/L is indicated by a red horizontal line.](/cms/asset/9a835288-23ae-4aa0-af9d-8564f4cb2e46/iclb_a_2137690_f0002_c.jpg)