Figures & data
Table 1. Demographic and clinical characteristics of all participants.
Figure 1. Untargeted metabolomics analysis among the four groups of NAFLD, VLD, ALD and Healthy group. (A, B) PCA score 3D plots of serum metabolites for four groups. (C, D) OPLS-DA score plots of serum metabolites for four groups. (E, F) validation plot of OPLS-DA, whether indicates that the original model is valid and overfitted.
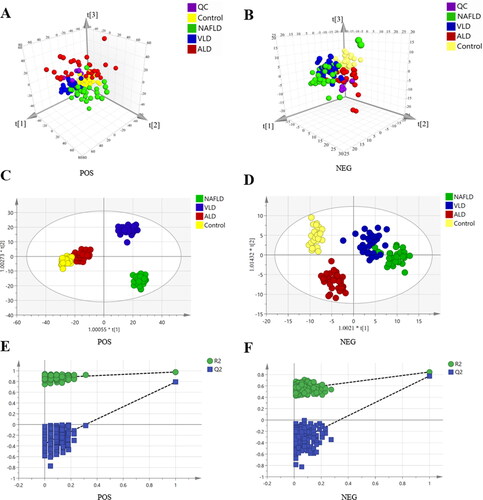
Figure 2. Differential metabolites and metabolic pathways in NAFLD, VLD, ALD and healthy groups. (A) Heatmap visualization of serum metabolites among the four groups. (B) Overview of pathway analyses based on selected metabolites.
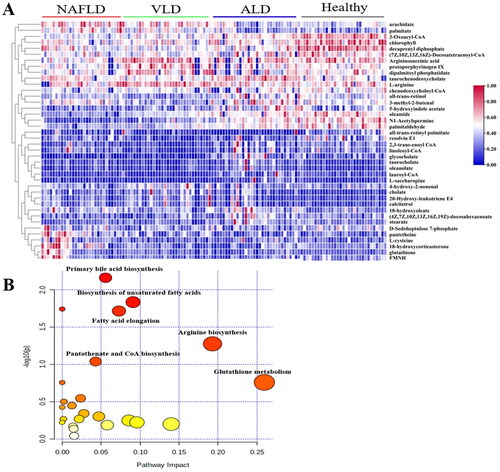
Figure 3. The differential bile acids of 18 in serum among four groups of ALD, NAFLD, VLD and healthy. The absolute concentration of bile acid is expressed in lg form. Data are presented as mean and standard. *p<0.05; **p<0.01.
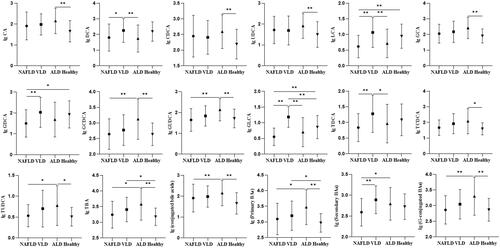
Figure 4. Receiver operating characteristic (ROC). (A) ROC curves of 22 BAs compared with Healthy group in NAFLD, VLD, ALD and ALC groups, respectively. (B) ROC curves of 12 differential BAs compared with the healthy group in ALD. (C) ROC curves of 18 differential BAs compared with the healthy group in ALC. (D) ROC curves of 19 differential bile acids compared with the ALD group in ALC.
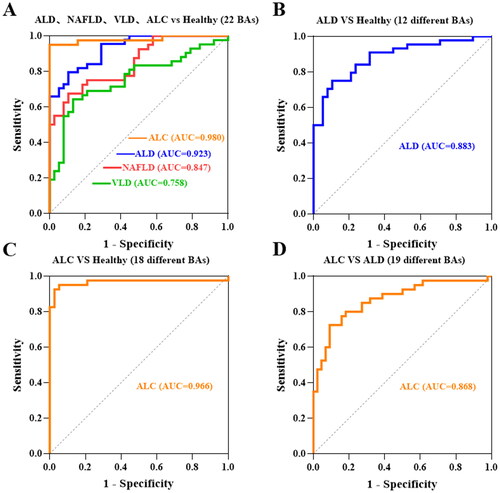
Figure 5. Heatmap visualization of 22 bile acids among the three groups of healthy, ALD and ALC.
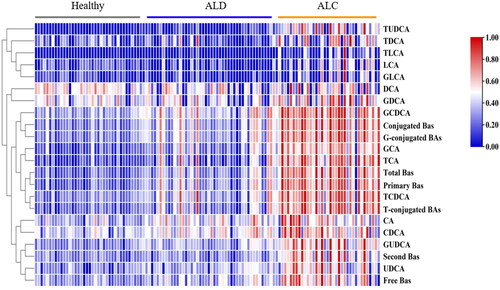
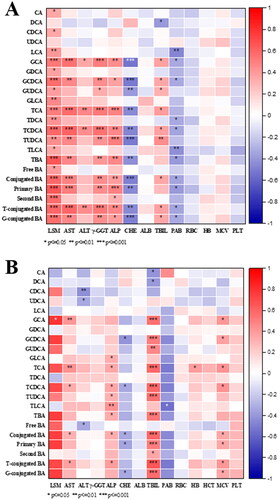
Figure 6. Heatmaps of partial Spearman correlation coefficients between all BA relevant variables and clinical indices. (A) ALD group; (B) ALC group.