
Figures & data
Table 1. Clinical characteristics on admittance of 286 COVID-19 patients.
Table 2. Clinical routine laboratory characteristics of 286 patients with severe COVID-19.
Table 3. Clinical outcome characteristics of 286 patients with severe COVID-19.
Figure 1. Median plasma creatinine (left upper plot) and creatinine based eGFR (right upper lot), median plasma Cystatin-C (left lower plot) and Cystatin-C based eGFR (right lower plot) divided in groups of ICU deceased (black line with dots), ICU survivors (black whole line) and non-ICU patients (broken black line).
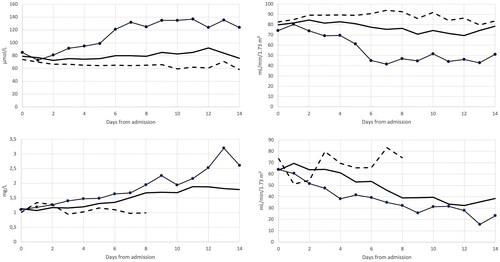
Figure 2. Left panel: median creatinine based eGFR (broken black line) and Cystatin-C based eGFR (black line) over time. Right panel: eGFRCYS/eGFRCR ratio (grey line) over time.
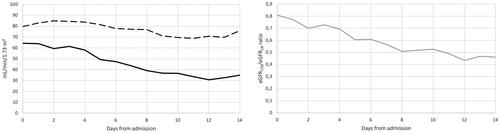
Table 4. Discrepant eGFR in patients with severe COVID-19.