Figures & data
Table 1. Baseline characteristics.
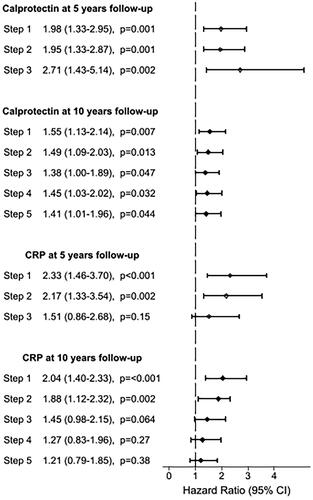
Figure 1. Hazard ratios for biomarkers associated with cardiovascular events. HR is expressed per 1 SD increase of loge calprotectin and loge CRP at 5 and 10 years follow-up. Age was used as time axis and thereby adjusted for in all models. Step 1: adjusted for age. Step 2: adjusted for age, sex and cystatin C. Step 3: adjusted for age, sex, cystatin C and previous CVD. Step 4: adjusted for age, sex, cystatin C, previous CVD, systolic blood pressure, high-density lipoprotein (HDL) cholesterol and HbA1c. Step 5: adjusted for age, sex, cystatin C, previous CVD, HDL cholesterol, HbA1c, CRP and calprotectin. HR: hazard ratio; CI: confidence interval; CVD: cardiovascular disease; CRP: C-reactive protein.