
Figures & data
Figure 1. Spearman’s correlation at baseline between calprotectin levels examined by use of ELISA or FEIA in the ARCTIC cohort of early RA (A) as well the ULRABIT cohort of established RA (B).
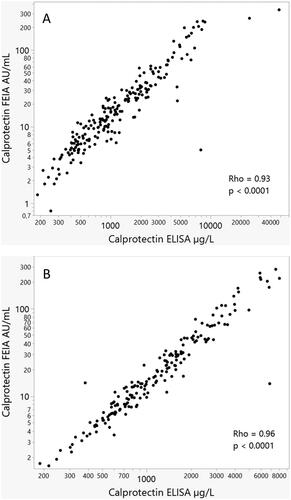
Table 1. Spearman’s rank correlations at baseline between calprotectin (assessed by ELISA or FEIA)/CRP/ESR and clinical as well as ultrasound assessments of disease activity in the cohorts of early or established RA (p < 0.001 for all correlations).
Data availability statement
The data will be shared if there is a reasonable request for it.