
Figures & data
Table 1. Characteristics of the enrolled healthy pregnant and non-pregnant women.
Figure 1. Concentrations of thrombin-antithrombin complex (TAT), α2-plasmininhibitor-plasmin complex (PIC), thrombomodulin (TM) and tissue plasminogen activator-inhibitor complex (tPAI-C) in non-pregnant women (N), first trimester (F), second trimester (S), third trimester (T) and before labor (pre-L). The bars represent the 25th and 75th percentiles with the medians (horizontal lines). the end of the vertical lines represents the 2.5 and 97.5 percentiles. P: p-values.
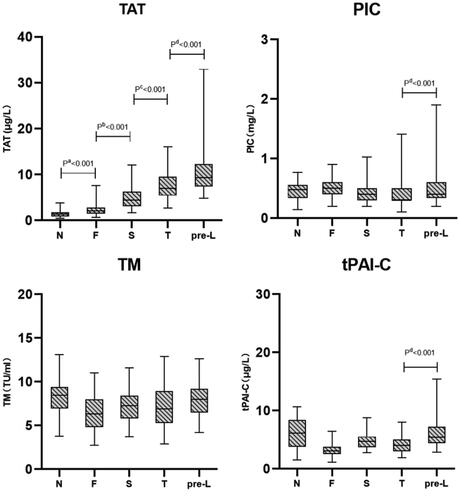
Table 2. Median and 95% reference intervals for TAT, PIC, TM and tPAI-C of pregnant women and non-pregnant women in trimester-specific groups.