
Figures & data
Table 1. Characteristics of responders to the electronic survey vs. the group of GPs invited in the study.
Table 2. GP characteristics in the intervention groups. Absolute numbers and percentage of GPs answers.
Table 3. Survey questions regarding clinic working routines. Absolute numbers and percentage of GPs answers.
Figure 1. a) the percentage of GPs who found the guidelines helpful to ‘high’ or ‘somé degree; b) the percentage of GPs who read the feedback reports ‘always’ or ‘often’; c) the percentage of GPs who found it problematic that the pop-up alert was displayed every time a test of Vitamin D was requested.
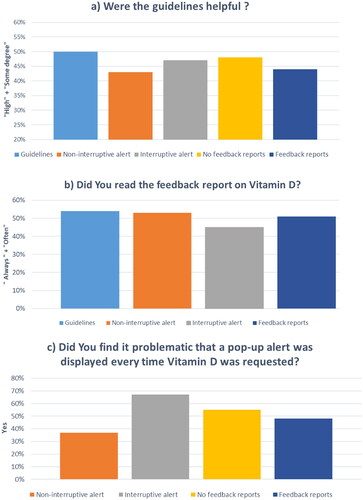
Table 4. Overview question. The rating of the interventions reported by each group of GPs.
Supplemental material