Figures & data
Figure 1. Change in number of whole blood phosphatidylethanol (PEth) tests performed per year over the last decade at the Karolinska University Laboratory (Stockholm, Sweden), relative to the number of tests in 2013 when PEth measurement was harmonized in Sweden [Citation12]. For comparison, the corresponding results for another commonly used alcohol biomarker in blood, serum carbohydrate-deficient transferrin (CDT), is also presented.
![Figure 1. Change in number of whole blood phosphatidylethanol (PEth) tests performed per year over the last decade at the Karolinska University Laboratory (Stockholm, Sweden), relative to the number of tests in 2013 when PEth measurement was harmonized in Sweden [Citation12]. For comparison, the corresponding results for another commonly used alcohol biomarker in blood, serum carbohydrate-deficient transferrin (CDT), is also presented.](/cms/asset/dc8bec60-896a-42ad-b937-a1847eb77a23/iclb_a_2253734_f0001_c.jpg)
Figure 2. Relative distribution of phosphatidylethanol 16:0/18:1 (PEth) values in whole blood samples from clinical routine PEth measurement at the Skåne University Hospital (Lund, Sweden) and the Karolinska University Laboratory (Stockholm, Sweden) in 2020–2021 (each based on > 60,000 measurements annually). Insert: Results from the Karolinska were also presented separately for samples from drug dependence units, showing overall higher PEth values (* p < 0.0001; chi-squared test), and all other units. According to a Swedish harmonization of PEth measurement in 2013 [Citation12], values below 0.05 µmol/L indicate sobriety or only low or sporadic alcohol consumption, values in the range 0.05–0.30 µmol/L confirm alcohol consumption from a low to a high level, and values above 0.30 µmol/L indicate regular high, harmful alcohol consumption.
![Figure 2. Relative distribution of phosphatidylethanol 16:0/18:1 (PEth) values in whole blood samples from clinical routine PEth measurement at the Skåne University Hospital (Lund, Sweden) and the Karolinska University Laboratory (Stockholm, Sweden) in 2020–2021 (each based on > 60,000 measurements annually). Insert: Results from the Karolinska were also presented separately for samples from drug dependence units, showing overall higher PEth values (* p < 0.0001; chi-squared test), and all other units. According to a Swedish harmonization of PEth measurement in 2013 [Citation12], values below 0.05 µmol/L indicate sobriety or only low or sporadic alcohol consumption, values in the range 0.05–0.30 µmol/L confirm alcohol consumption from a low to a high level, and values above 0.30 µmol/L indicate regular high, harmful alcohol consumption.](/cms/asset/f6f92dd3-c381-4a7b-94fc-03f4b216c5d0/iclb_a_2253734_f0002_c.jpg)
Figure 3. Results from harmonization activities in the Equalis (Uppsala, Sweden) external quality assessment (EQA) scheme for measurement of phosphatidylethanol 16:0/18:1 (PEth; Phosphatidyl ethanol, article nr 295) in whole blood, showing A) a relatively large spread in reported PEth values (N = 11–27) with coefficients of variation (CV) at ∼20%, irrespective of the PEth level with native patient pools using in-house methods (round 2018:01), with various treated sample materials (freeze-dried, spiked and pre-extracted pools) (rounds 2019:01 and 2018:02), and use of the same sample processing method (Swedish laboratories only; round 2018:04). Shown are Box-and-whisker plots. B) The intra-laboratory variation was generally much smaller (< 10%), although the results for 5 laboratories differed 12–34%, indicating that the larger inter-individual difference was due to calibration problems. Shown are passing & bablok regression (y = 0.000 + 1.000 x) and Box-and-whisker plots for two identical blinded EQA samples distributed in the same round (round 2018:05). However, upon enquiry, (C) no clear differences in PEth results emerged depending on how the calibrators were prepared (N = 22). (D) Using two blinded EQA samples with assigned PEth values as low and high calibrators and recalculating the value for a third sample with a concentration in between (round 2019:01), the internal-calibrated CV was significantly lower (N = 26), confirming that the spread was largely due to differences in method calibration.
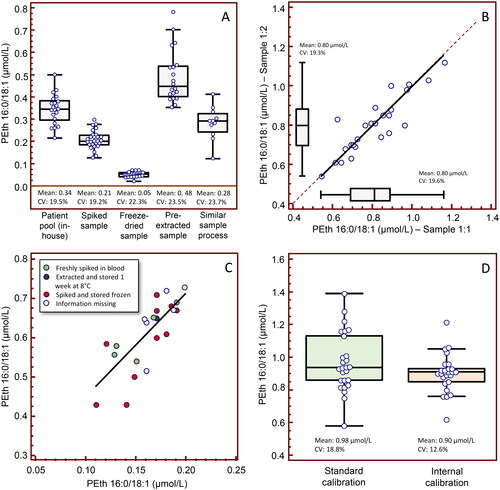
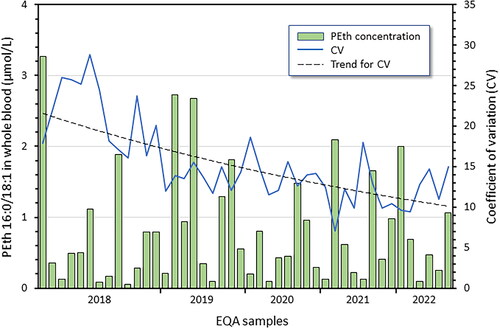
Figure 4. Results from the Equalis (Uppsala, Sweden) external quality assessment (EQA) scheme for measurement of phosphatidylethanol 16:0/18:1 (PEth; Phosphatidyl ethanol, article nr 295) in whole blood. Shown are the average PEth values in control materials distributed during 2018–2022, the variation in reported values (CV) for the Swedish laboratories (N = 13–15), and a trend line for the CV. The overall agreement of PEth results has gradually improved and the average CV fallen from > 20% in 2018 to ∼12% in 2021–2022, independent of the PEth level in the tested range 0.05–3.3 µmol/L.