Figures & data
Figure 1. Plasma levels of legumain in the (A) total population of FH subjects and controls (controls, n = 96; FH, n = 251), (B) in children and young adults (controls, n = 64; FH, n = 85) and (C) in the adult populations (controls, n = 32; FH, n = 166). FH, familial hypercholesterolemia. P values are from Welch Two Sample t-tests.
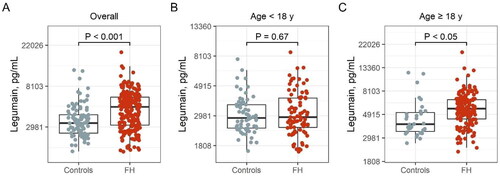
Figure 2. Plasma levels of legumain in adult FH subjects according to statin use (no statin use, n = 33; statin use, n = 133). FH: familial hypercholesterolemia. p value is from Welch Two Sample t-test.
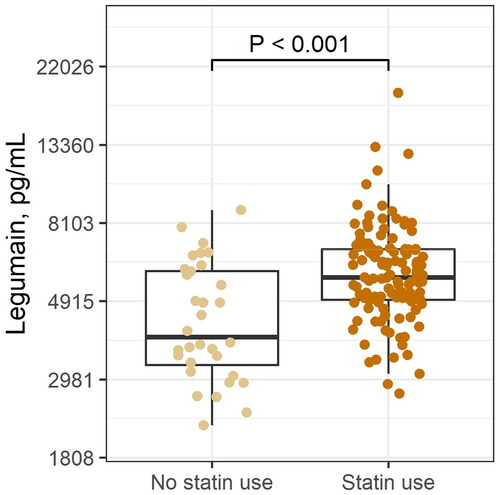
Table 1. FH subjects and healthy control <18 years of age.
Table 2. FH subjects and healthy control 18 years of age and older.
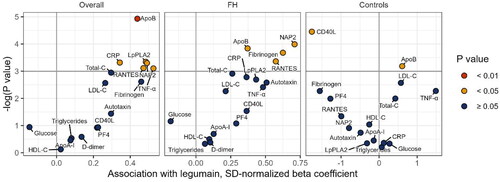
Figure 3. Association between legumain and clinical and inflammatory/platelet activation markers in the total population of FH subjects and controls (right), only FH subjects (Middle) and controls (left). The volcano plots show regression coefficients and 95% CIs from multiple regression analyses adjusted for age, sex, BMI, and statin use (statin use not relevant for control group). Colors indicate p-value. Prior to modeling, to enable visualization in a volcano plot, we scaled each clinical and inflammatory/platelet activation marker to a standard normal distribution by subtracting the mean and dividing by its standard deviation. FH: familial hypercholesterolemia; LDL-C: low-density lipoprotein cholesterol; HDL-C: high-density lipoprotein cholesterol; apoB: apolipoprotein B; apoA-1: apolipoprotein A1; CRP: C reactive protein; Lp-PLA2: LDL-associated phospholipase A2; PF4: platelet factor 4; NAP2: neutrophil activating protein; TNF: tumor necrosis factor; SD: standard deviation.