
Figures & data
Table 1. Median glucose concentration (1st-3rd quartile) at T0 according to tube type.
Figure 1. Relative difference of glucose concentration (%) vs. T0 after storage of centrifuged samples at 20–22 °C according to tube type. Mean difference between baseline glucose and glucose after storage is shown with red data points (90% confidence interval). Individual differences are shown as grey data points. The red dashed lines present the maximal allowable bias, the grey dashed lines present the maximal allowable total error. (A) Fast-clotting serum, (B) NaF–EDTA–citrate plasma and (C) serum.
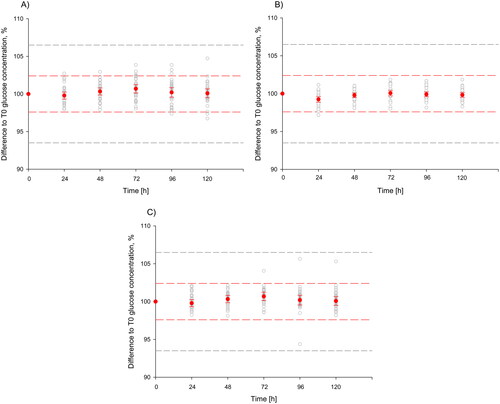
Table 2. Median glucose concentration (1st–3rd quartile) at 20–22 °C according to tube type and storage time.