
Figures & data
Figure 1. Study flow chart demonstrating selection of patients to the study.
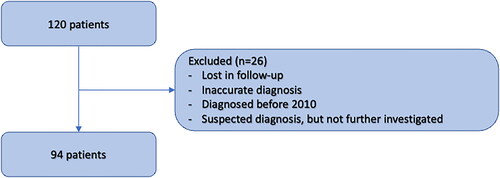
Figure 2. CMR images of an 83-year-old male diagnosed with AL amyloidosis. The left image (Panel A – 4-chamber view) displays the typical distribution of Late Gadolinium Enhancement (LGE), with a prominent subendocardial involvement in the left ventricle and encompassing the walls of all cardiac chambers, including the interatrial septum. In the right image (Panel B), native T1 mapping acquisition (transverse plane) reveals an elevated measurement within the interventricular septum, registering at 1448 milliseconds. This value exceeds the recommended threshold, which should ideally be below 1371 milliseconds, their upper normal value is defined as mean + 2 standard deviations (SD).
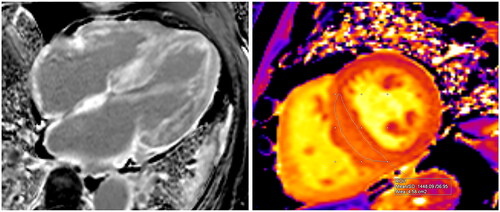
Figure 3. Electrocardiographic and echocardiography (apical 4-chamber view) images showing low voltage QRS (A) and huge left ventricular hypertrophy (B), arrow pointing towards interventricular septum) in a study participant with amyloidosis.
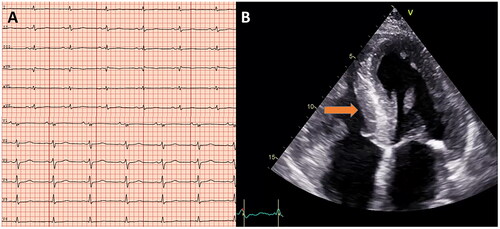
Figure 4. Correlations between NT-proBNP and myocardial mass on CMR (g), p = 0.003.
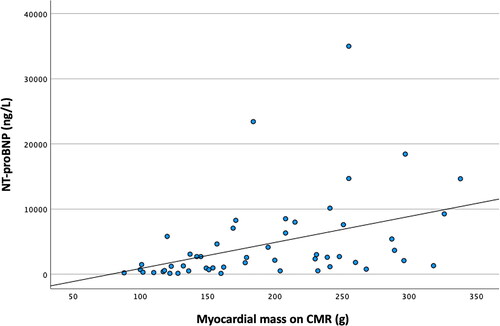
Figure 5. Correlation matrix. The figure give the correlation between the different parameters investigated, the values are given as Pearson correlation coefficient (PCC) and corresponding p-values. Negative PCC indicates a negative correlation, and positive PCC indicates positive correlation. Abbreviations: EF: LV ejection fraction (%) on CMR. GLS: global longitudinal strain on echocardiography.
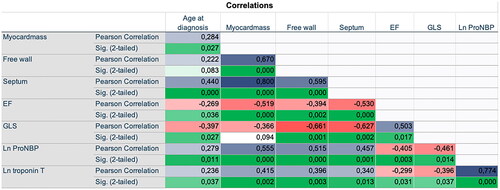
Table 1. Baseline characteristics and laboratory data.
Table 2. Echocardiographic and cardiac magnetic resonance (CMR) imaging characteristics.
Figure 6. Kaplan–Meier curves of atrial fibrillations (upper) and atrial dilatation (lower), with log rank p values.
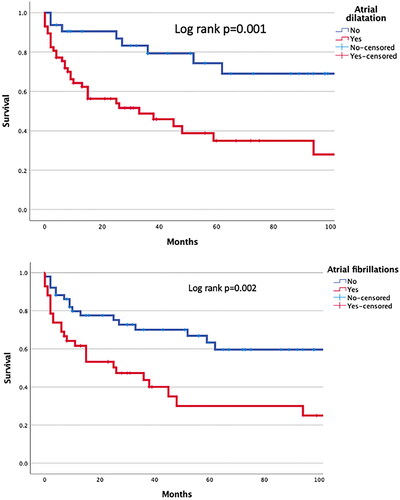
Table 3. Univariate and multivariate associations with all-cause mortality.