Figures & data
Figure 1. PsoP27 peptide sequence and the detection of Abs against native and citrullinated PsoP27 in SF of PsA and RA patients. (A) Illustration of the PsoP27 peptide sequence (marked in black box) on the SERPINB3 protein. SFs were analyzed for levels of Abs against native (B) and citrullinated (C) PsoP27 in samples of PsA (n = 48), RA (n = 22) and OA (n = 23) patients. Levels of Abs against PsoP27 are shown as the value of optical density (O.D.). The p values were calculated by the non-parametric one-way ANOVA Kruskal–Wallis test and Dunn’s multiple comparison test, *p < .0001, ns: non-significant.
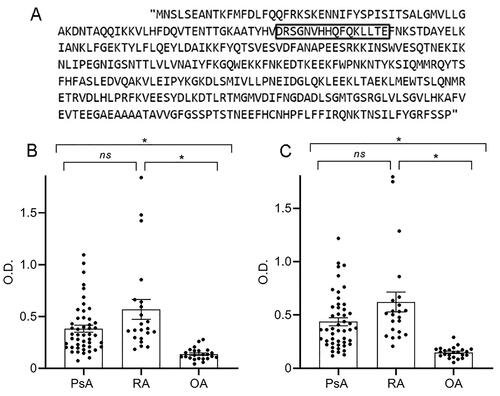
Figure 2. Level of Abs against citrullinated PsoP27 in SF of seropositive and seronegative RA patients. SF were analyzed for level of Abs against citrullinated PsoP27 in samples of seropositive (n = 14) and seronegative (n = 14) RA patients. Level of Abs against citrullinated PsoP27 is shown as the value of optical density (O.D.). The p values were calculated using the Mann–Whitney U test. ns: non-significant.
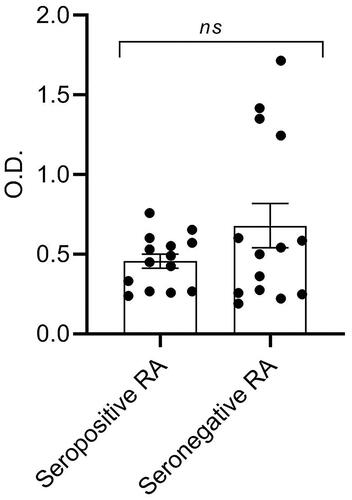
Figure 3. Sera levels of Abs against native and citrullinated PsoP27. Sera were analyzed for levels of Abs against native (A) and citrullinated (B) PsoP27. Samples were derived from PsA (n = 32) and RA (n = 32) patients and healthy controls (n = 31). Levels of Abs against PsoP27 are shown as the value of optical density (O.D.). The p values were calculated using the one-way ANOVA Kruskal–Wallis test and Dunn’s multiple comparison test. ns: non-significant.
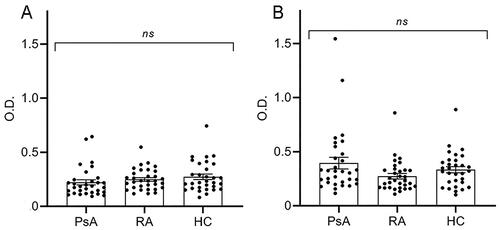
Table 1. Demographic and clinical characteristics of (A) PsA, RA and OA patients in the SF section and (B) PsA and RA patients and healthy controls in the serum section.
Figure 4. Correlation between level of Abs against PsoP27 in SF of PsA patients and systemic CRP. Both levels of Abs against native and citrullinated PsoP27 in SF correlated positively with CRP level in the PsA cohort. Each point represents single SF sample of PsA patient. The x-axis reflects the levels of Abs against native PsoP27 (A) and citrullinated PsoP27 (B) in optical density (O.D.). The y-axis reflects the systemic CRP level (mg/L). The relationship between variables was evaluated using the Pearson rank correlation test. Trend lines indicate linear correlation. r: Pearson’s rank correlation coefficient, p value indicates statistical significance.
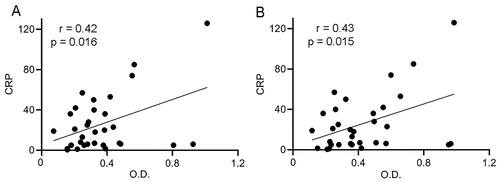
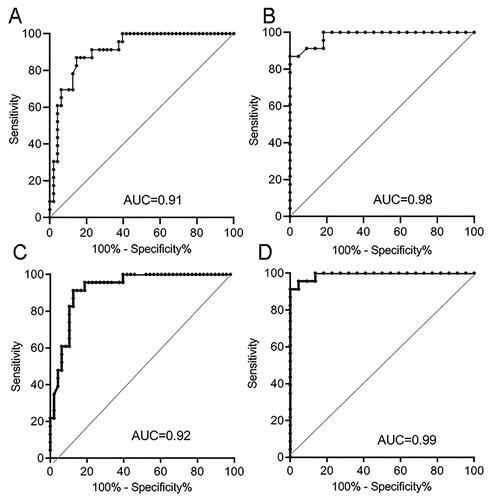
Figure 5. Receiver operating characteristic (ROC) curve analysis to assess the capacity of Abs against citrullinated PsoP27 in SF to discriminate between PsA and RA and OA patients. Abs against native PsoP27 to discriminate between (A) PsA versus OA patients, and (B) RA versus OA patients. Abs against citrullinated PsoP27 used to discriminate between (C) PsA versus OA patients and (D) RA versus OA patients.