
Figures & data
Figure 1. The proportion of positive SARS-CoV-2 antibody samples each week among blood donors. Total number of samples n = 20,651, positive number of samples n = 4439.
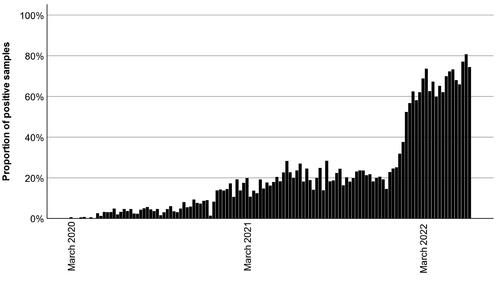
Table 1. SARS-CoV-2 N-antibody prevalence in the study population. The Chi-square test determined the p of the categorical variables; the Mann–Whitney U-test was used for continuous variables.
Table 2. Pairwise comparison of N-antibody titers between first and second antibody-positive donation during the first episode. The p-values were determined using the Related-Samples Wilcoxon signed rank test.
Figure 2. Kaplan–Meier survival curve describing antibody presence in donors whose N-antibodies waned below the detection limit of the assay (n = 60). Only the first episode of antibody positivity was included.
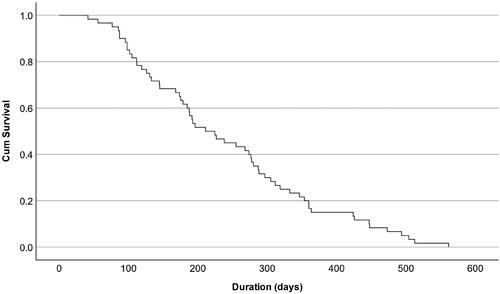
Table 3. Description of donors who lost their N-antibodies. The proportion of donors who lost their N-antibodies, as percent of the antibody-positive donors of each subgroup.