Figures & data
Table 1. Clinical characteristics of patients.
Figure 1. Fibrin network permeability (Ks—see method section—clotting triggered with TF) in samples from patients treated with dabigatran (n = 23), rivaroxaban (n = 26), apixaban (n = 20), and warfarin (n = 27)—results presented as Ks % of normal Pool plasma (NPP). All treatment groups had higher permeability than commercial NPP (p < 0.01). Differences between groups evaluated with Kruskal Wallis test followed by Dunn’s post-hoc testing if significant. p-Values represent the significance level of post-hoc testing.
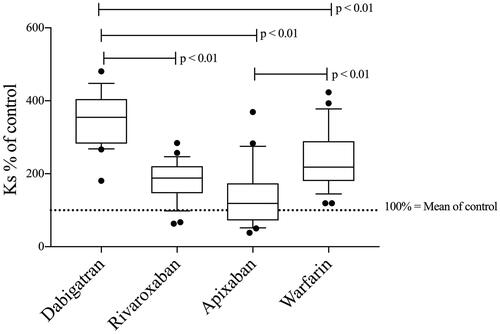
Table 2. Results from tests of hemostasis.
Figure 2. Scanning electronic microscope images showing the fibrin network structure in selected dabigatran- (a,b), apixaban- (c,d), rivaroxaban- (e,f), and warfarin-treated (g,h) patients with different fibrin network permeability (Ks) as well as NPP for comparison (i). The respective DOAC concentration or PT-INR is provided below each image.
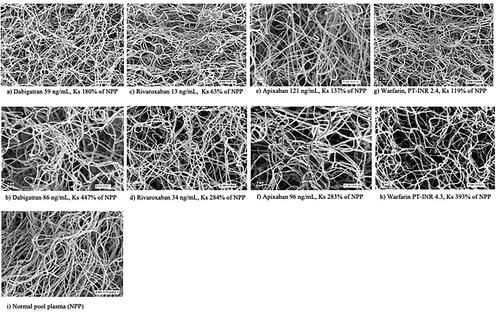
Figure 3. Fibrin network permeability in commercial NPP spiked with eight different concentrations of DOAC (13–1000 ng/mL) and in PPP from warfarin-treated patients with PT-INR values ranging from 1 to 9 (n = 7; each sample concentration analyzed once). Results presented as Ks % of NPP. Expected range of concentration [10th–90th percentile (median)] at the trough for each DOAC: Dabigatran (150 mg × 2) 40–215 (93), apixaban (5 mg × 2) 41–230 (103), rivaroxaban (20 mg × 1) 6–239 (32) [Citation10–12].
![Figure 3. Fibrin network permeability in commercial NPP spiked with eight different concentrations of DOAC (13–1000 ng/mL) and in PPP from warfarin-treated patients with PT-INR values ranging from 1 to 9 (n = 7; each sample concentration analyzed once). Results presented as Ks % of NPP. Expected range of concentration [10th–90th percentile (median)] at the trough for each DOAC: Dabigatran (150 mg × 2) 40–215 (93), apixaban (5 mg × 2) 41–230 (103), rivaroxaban (20 mg × 1) 6–239 (32) [Citation10–12].](/cms/asset/f4e59059-5cb3-4a1f-9b04-69e4f3b654f7/iclb_a_2369993_f0003_b.jpg)
Figure 4. CAT (see method section—thrombin generation after clotting triggered with TF) lag time (A), ETP (B), and peak thrombin (C) in samples from patients treated with dabigatran (n = 23), rivaroxaban (n = 26), apixaban (n = 20), and warfarin (n = 26). Peak thrombin and ETP data were not analyzed in dabigatran-treated patients due to the interaction between dabigatran and α2-macroglobulin-thrombin complex in the calibration sample as previously described [Citation48–52]. Differences between groups evaluated with Kruskal Wallis test followed by Dunn’s post-hoc testing if significant. p-Values represent the significance level of post-hoc testing.
![Figure 4. CAT (see method section—thrombin generation after clotting triggered with TF) lag time (A), ETP (B), and peak thrombin (C) in samples from patients treated with dabigatran (n = 23), rivaroxaban (n = 26), apixaban (n = 20), and warfarin (n = 26). Peak thrombin and ETP data were not analyzed in dabigatran-treated patients due to the interaction between dabigatran and α2-macroglobulin-thrombin complex in the calibration sample as previously described [Citation48–52]. Differences between groups evaluated with Kruskal Wallis test followed by Dunn’s post-hoc testing if significant. p-Values represent the significance level of post-hoc testing.](/cms/asset/e20c8108-a576-4184-8553-f04098eb9c5e/iclb_a_2369993_f0004_b.jpg)
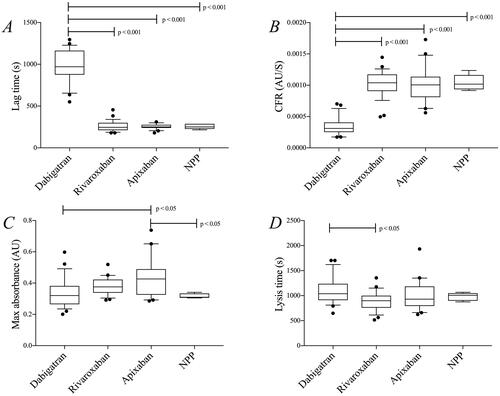
Figure 5. Results from the turbidimetric clotting and lysis assay (see method section—clotting triggered with thrombin) in samples from patients treated with dabigatran (n = 23), rivaroxaban (n = 26), and apixaban (n = 20). Commercial NPP was used for comparison (five repeated runs). (A) lag time, (B) CFR, (C) max absorbance, and (D) lysis time. Differences between groups were evaluated with one-way ANOVA followed by Tukey’s post-hoc testing if significant. p-Values represent the significance level of post-hoc testing.