Figures & data
Table 1. Intravenous dosing regimen of iron isomaltoside in IBD patients with iron deficiency anaemia.
Table 2. Baseline demographics by infusion regime of intravenous iron isomaltoside.
Figure 1. Changes from baseline in haemoglobin, s-ferritin, transferrin saturation and reticulocyte concentration over time in patients treated with 1500–2000 mg iron isomaltoside (group A) and 2500–3000 mg iron isomaltoside (group B). Least square means (95% CIs) are derived from a repeated measures mixed model with treatment and week as factors and baseline value as covariate. *p < 0.05, **p < 0.01, ***p < 0.001 (test for difference from baseline value).
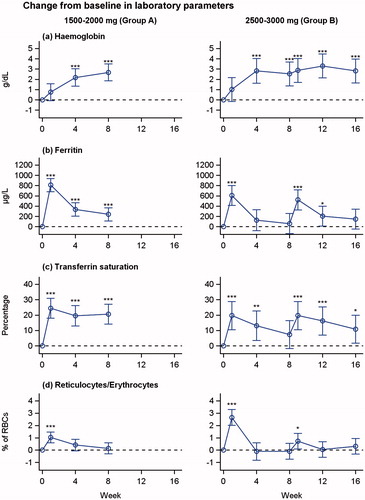
Figure 2. Change in iFGF23 and s-phosphate levels from baseline (blue line: change from baseline to week 8 in all patients after first dosing) and week 8 (red line: change from week 8 in patient dosed twice). Mean and 95% confidence interval of mean.
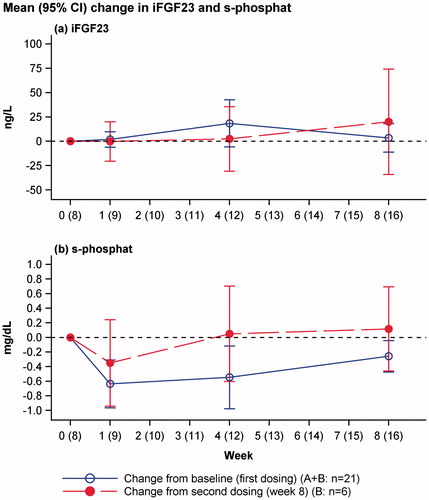
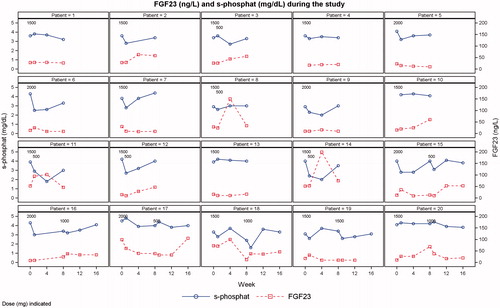
Figure 3. Individual plots of s-phosphate and iFGF23 levels. One patient was excluded due to having only baseline data.