Figures & data
Figure 1. The flowchart of the study screening and the detailed selection process.
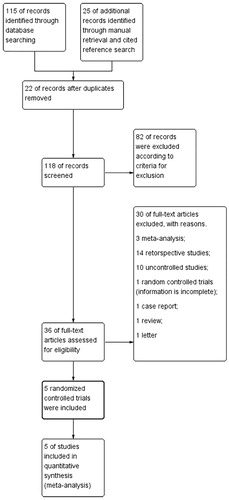
Table 1. Clinical background of studies included in the meta-analysis.
Table 2. Interventions of included trials.
Table 3. Bias assessment of studies included in the meta-analysis.
Figure 2. (A) Forest plot of the subgroup analysis on the DFS. (B) Forest plot of the subgroup analysis on the OS.
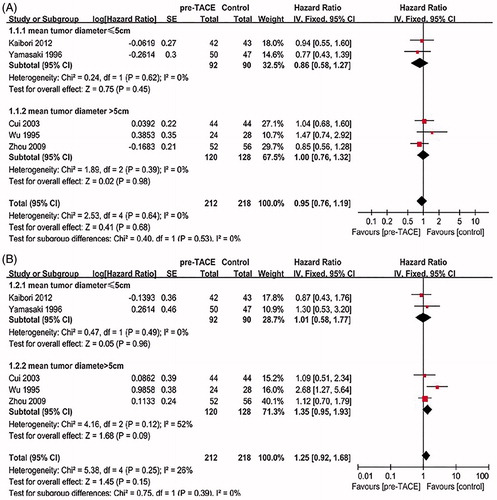
Figure 3. (A) Forest plot of the subgroup analysis on the perioperative mortality. (B) Forest plot of the subgroup analysis on the postoperative morbidity
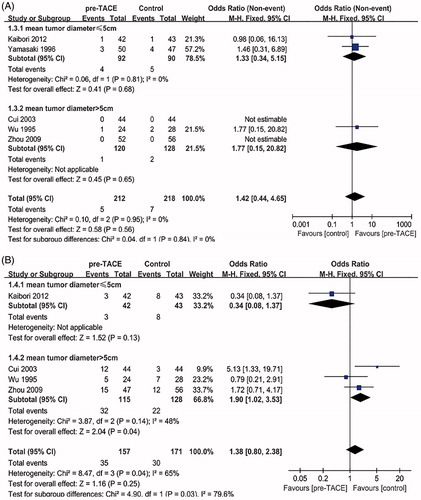
Figure 4. (A) Forest plot of the subgroup analysis on the blood loss. (B) Forest plot of the subgroup analysis on the operation time
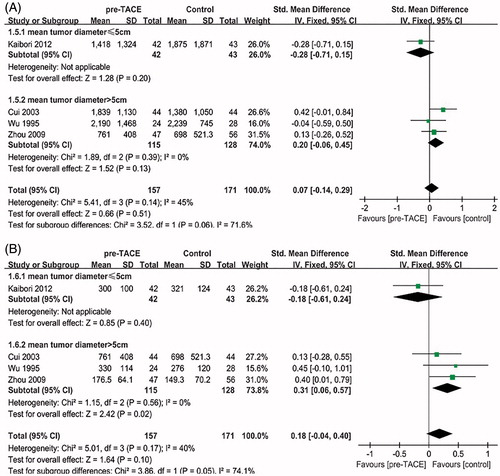
Figure 5. Forest plot of the subgroup analysis on the combined resection of perihepatic organs.
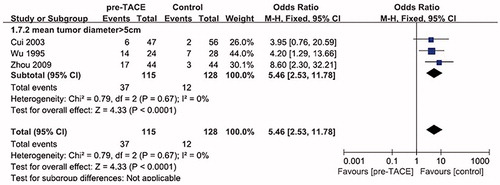
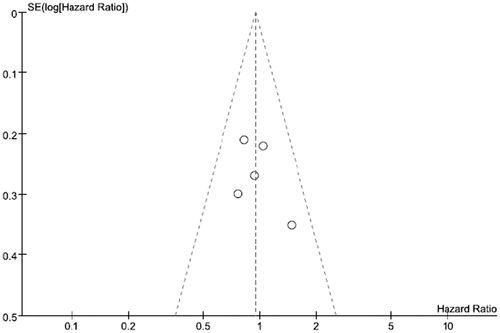
Figure 6. The funnel plot for overall disease-free survival of the included studies.