
Figures & data
Table 1. Baseline characteristics of study population.
Figure 1. Box plots of the distributions of (A) pathologists estimate of fibrosis, (B) LSM, (C) ELF score and (D) MRI T1 relaxation time with fibrosis stage.
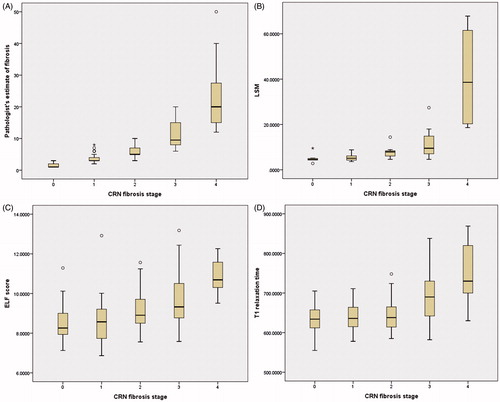
Table 2. Study parameters distribution by fibrosis stage.
Figure 2. Area under receiver operating curves (AUROC) of study variables for advanced fibrosis.
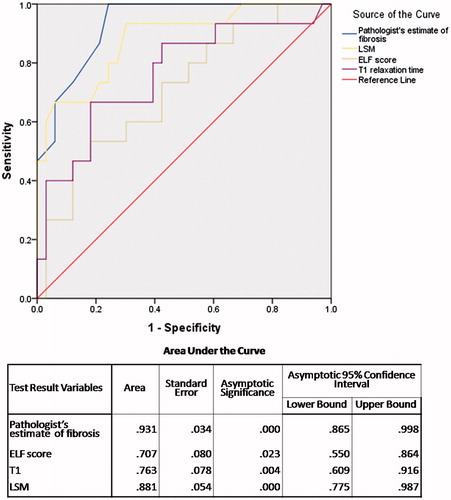
Figure 3. Area under receiver operating curves (AUROC) of study variables for cirrhosis.
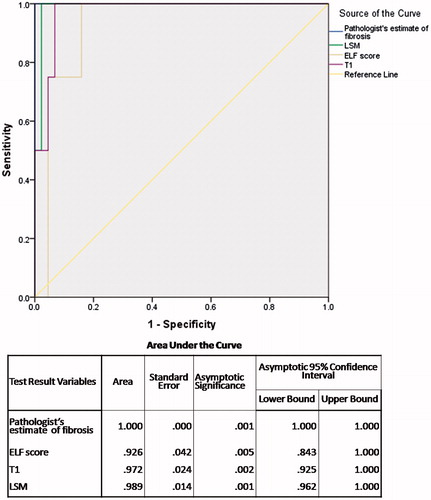
Figure 4. Scatter plot of distribution of (A) LSM, (B) ELF score and (C) T1 relaxation time with pathologist’s estimate of fibrosis in F3–F4 group.
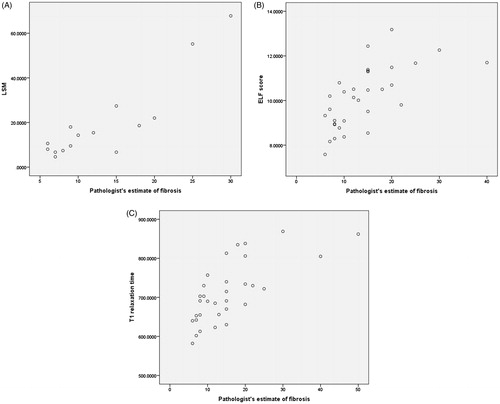
Figure 5. Scatter plot of distribution of (A) LSM, (B) ELF score and (C) T1 relaxation time with pathologist’s estimate of fibrosis in F0–F2 group.
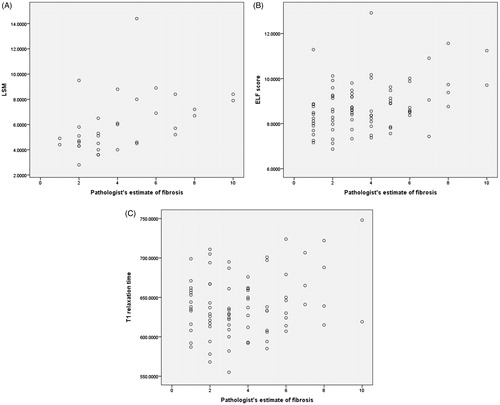
Table 3. Correlation of study parameters with pathologist’s estimate of fibrosis.