Figures & data
Table 1. Patient characteristics.
Figure 1. Number of pack years compared between patients with no-early (stage 0–2) and advanced fibrosis (stage 3–4). Panel A shows the difference in number of pack years (represented with boxplots with median, IQR and min–max value) for the whole cohort. Panel B shows the difference in number of pack years (represented as mean + standard error of the mean) for ever smokers (active and past smokers).
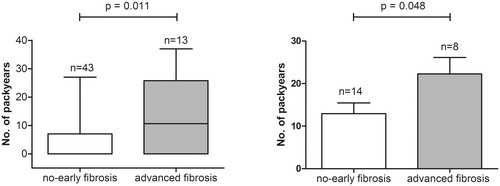
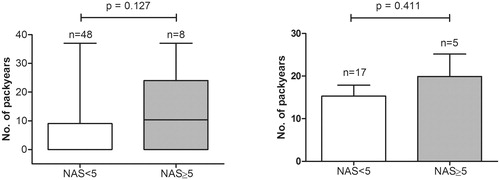
Figure 2. Number of pack years in patients with a NAS lower than 5 compared to patients with a NAS of 5 or higher. Panel A shows the difference in number of pack years (represented with boxplots with median, IQR and min–max value) for the whole cohort. Panel B shows the difference in number of pack years (represented as mean + standard error of the mean) for ever smokers (active and past smokers).