
Figures & data
Figure 1. Flowchart of patients included in the study. Baseline resistance testing in the control group was performed retrospectively.
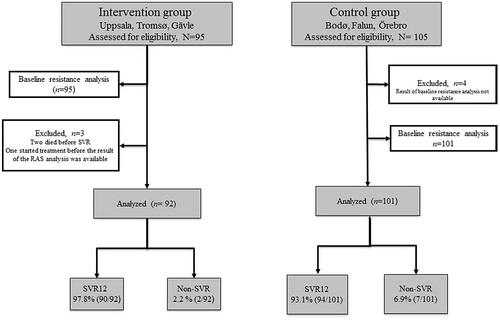
Table 1. Patient demographics and baseline characteristics.
Table 2. Treatment characteristics.
Figure 2. Sustained virologic response rates (SVR) in the intervention and control groups. SVR rates in the intervention group (dark grey bars) and the control group (light grey bars). The two bars to the right show SVR rates by simeprevir treatment in patients with baseline Q80K and R155K RAS in the control group.
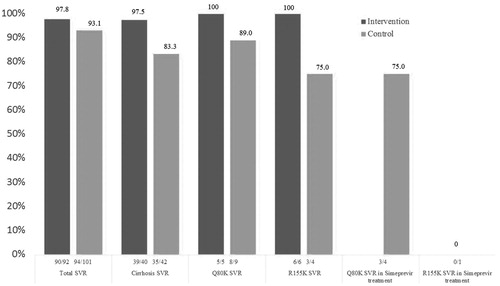
Table 3. Clinical characteristics, baseline and emerging RASs (NS3 and NS5A) in the non-responders.
Supplemental material