
Figures & data
Table 1. Demographics of the study group.
Figure 1. Diagnostic performance of CA 19-9, IL.17E, B7.1 and DR6 for discrimination of pancreatic cancer and healthy controls.
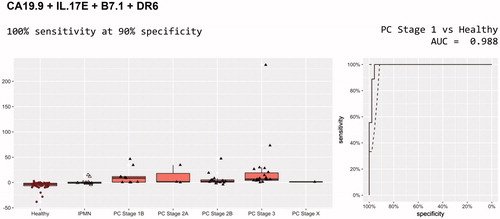
Table 2. Best models for pancreatic cancer versus healthy.
Figure 2. Diagnostic performance of CA 19-9, Eotaxin.2, CD163 and BMP.3b for discrimination of IPMN and healthy controls.
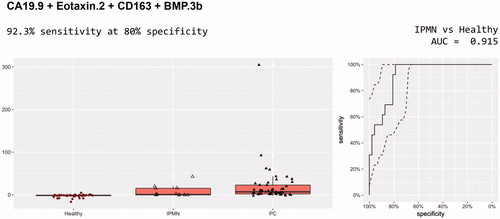
Table 3. Best models for IPMN versus healthy.
Figure 3. Diagnostic performance of B7.1 for discrimination of IPMN and healthy controls.
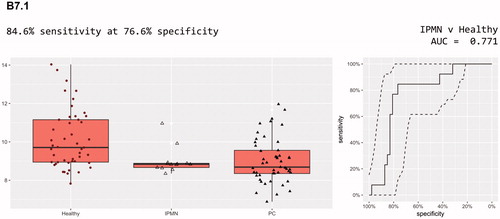
Figure 4. Diagnostic performance of CA 19-9, IL.17E, B7.1 and IL.12RBeta2 for discrimination of pancreatic cancer and IPMN.
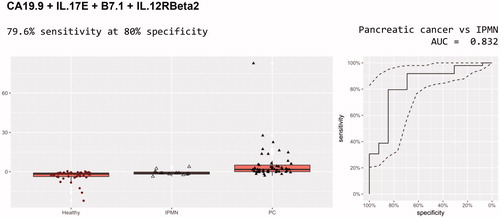
Table 4. Best models for pancreatic cancer versus IPMN.