
Figures & data
Figure 1. Flowchart of included participants.
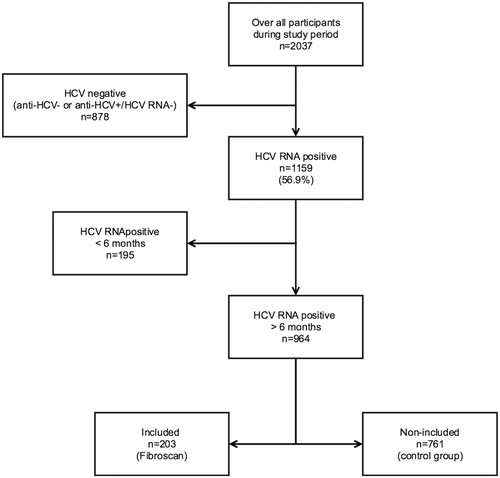
Table 1. Baseline demographics of included chronic hepatitis C (CHC) participants (n = 203) compared with non-included CHC participants (n = 761) at the Stockholm NEP during the study period.
Table 2. Association between baseline demographics and fibrosis stages classified as mild (F0–F2, LSM ≤9.4 kPa) versus advanced (F3–F4, LSM ≥9.5 kPa), (n = 203).
Figure 2. (a) The APRI score according to fibrosis stage F0–F2 mild fibrosis (LSM ≤9.4 kPa) and F3–F4 advanced fibrosis (LSM ≥9.5 kPa). A significant difference in APRI score was seen in participants with mild versus advanced fibrosis, p < .0001. (b)The APRI score according to fibrosis stage F0–F3 (no cirrhosis, LSM ≤12.4 kPa) and F4 (cirrhosis, LSM ≥12.5 kPa). A significant difference in APRI score was seen in participants with and without cirrhosis, p < .001.
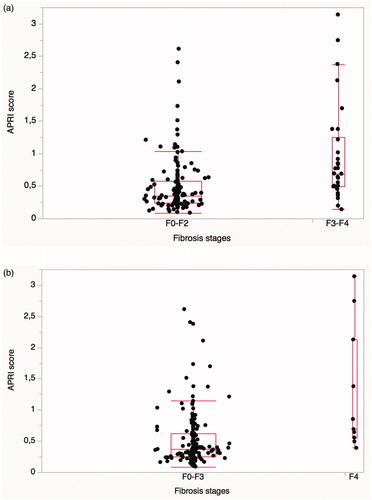
Figure 3. Advanced fibrosis (fibrosis stage F3–F4, LSM ≥9.5 kPa) and mild fibrosis (fibrosis stage F0–F2, LSM ≤9.4 kPa) plotted against age and IDU duration with cut-offs by age ≥40 years and IDU duration ≥15 years (dotted lines).
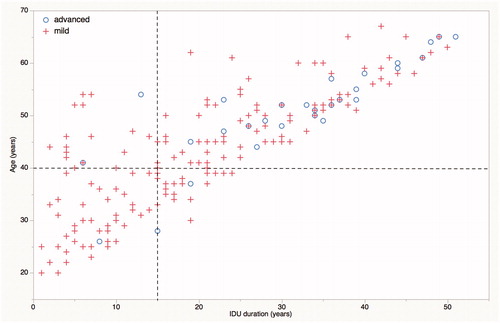
Table 3. Accuracy testing of possible cut-offs for detecting advanced fibrosis (LSM ≥9.5 kPa).