
Figures & data
Figure 1. Flow chart for patients’ inclusion.
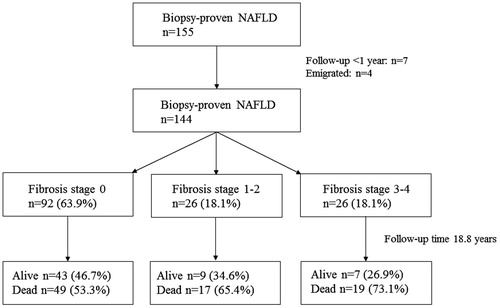
Table 1. Patients’ characteristics at baseline and follow-up.
Figure 2. Mean values of non-invasive fibrosis scores according to fibrosis stage, p < .001 for FIB-4, NFS and APRI, and p = .001 for BARD.
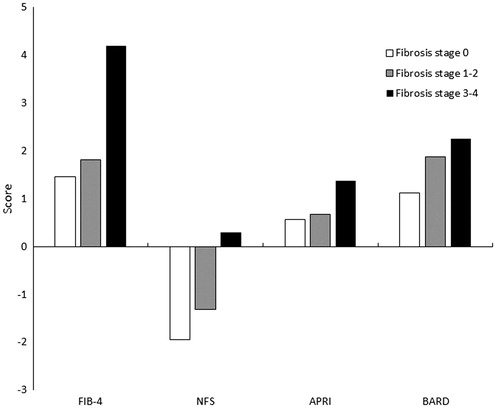
Table 2. Area under the ROC curve for non-invasive scoring systems in predicting outcomes (AUROC ± SE (95% CI)).
Table 3. Multivariate-adjusted Hazard Ratios (HR) for metabolic complications at follow-up according to risk categories in fibrosis scoring systems (HR (95% CI), p-value).
Table 4. Multivariate-adjusted Hazard Ratios (HR) for overall mortality and liver-related events according to risk categories in fibrosis scoring systems (HR (95% CI), p-value).