
Figures & data
Table 1. Patient characteristics at baseline.
Figure 1. Patient flowchart. N: number of patients.
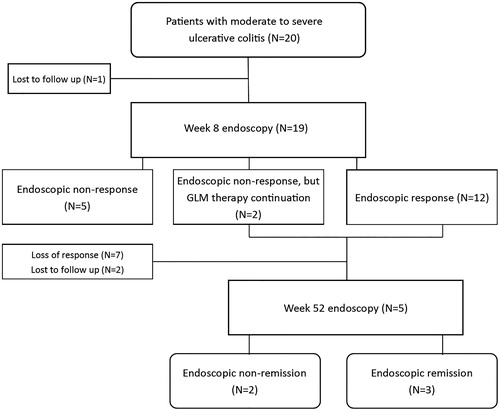
Figure 2. (a) Median [interquartile range] fecal calprotectin over time. n: number of patients. (b) Median [interquartile range] CRP over time. CRP: C-reactive protein.
![Figure 2. (a) Median [interquartile range] fecal calprotectin over time. n: number of patients. (b) Median [interquartile range] CRP over time. CRP: C-reactive protein.](/cms/asset/5c7d7ca7-4be4-4e03-a0b8-1a1cfe344c70/igas_a_1619828_f0002_b.jpg)
Figure 3. Median [interquartile range] GLM concentrations. GLM: golimumab.
![Figure 3. Median [interquartile range] GLM concentrations. GLM: golimumab.](/cms/asset/fe07258d-9f53-4960-ace6-4c9869fb25c3/igas_a_1619828_f0003_b.jpg)
Figure 4. Week 2 and 6 median [interquartile range] GLM concentrations and area under the curve in endoscopic responders and non-responders at week 8. GLM: golimumab.
![Figure 4. Week 2 and 6 median [interquartile range] GLM concentrations and area under the curve in endoscopic responders and non-responders at week 8. GLM: golimumab.](/cms/asset/0fd40738-1ed0-43a1-ae63-d5bebdd8fa57/igas_a_1619828_f0004_b.jpg)
Supplemental material