Figures & data
Figure 1. Map presenting study participants at represented hospital district in Finland including the number of patients treated with ustekinumab.
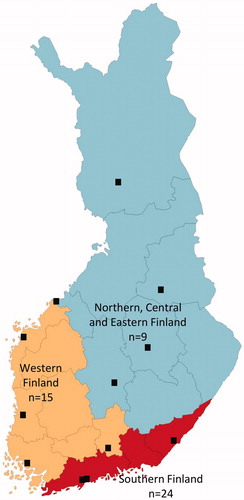
Table 1. Baseline patient characteristics and phenotype.
Table 2. Treatment history and concomitant drug use at baseline.
Figure 2. Flow-chart of ustekinumab (UST) treatment in the FINUSTE study population. A total of 48 Crohn’s disease patients received intravenous (iv) UST treatment at induction. Six patients (12.5%) lacked primary response or discontinued for other reasons. Forty-two patients (87.5%) continued UST treatment at 16 weeks. Two patients (4.2%) discontinued treatment due to lack of response after 16 weeks. Forty patients (83.3%) maintained UST at the end of follow-up, including 5 UST dose intensified patients and 35 not intensified.
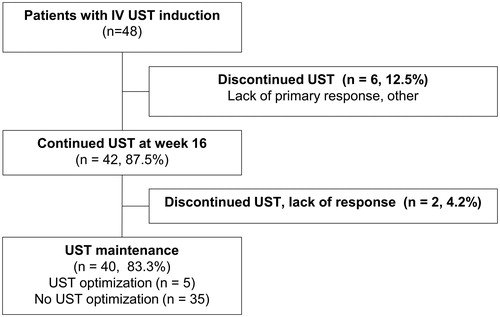
Figure 3. UST persistence (%) among Crohn’s disease patients presented in Kaplan–Meier rates.
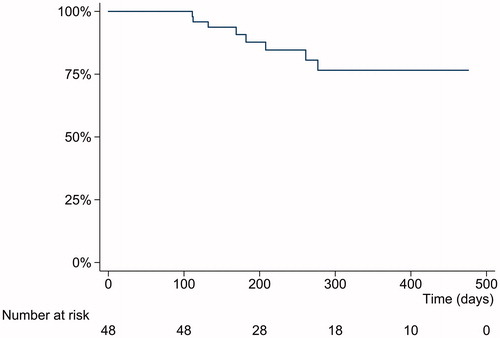
Figure 4. Concomitant drug use during ustekinumab treatment for Crohn’s disease (CD) at baseline, at 16 weeks, and at end of follow-up. Given are the total number of patients still using UST and the proportion of patients for the relevant CD treatment at specific time period. In parenthesis are the numbers of patients with available data. *Indicates statistically significant difference compared to baseline; p < .05.
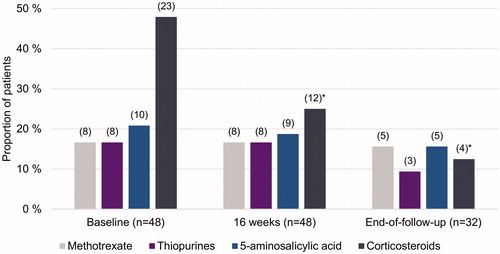
Figure 5. Box and whiskers plot showing upper-lower extreme and median changes in (a) the Simple Endoscopic Score for Crohn’s disease (SES-CD), (b) modified Harvey–Bradshaw index (mHBI), (c) faecal calprotectin (fCal) and (d) C-reactive protein (CRP), at baseline, at 16 weeks and at end of follow-up of Crohn’s disease patients treated with ustekinumab. In parenthesis are the numbers of patients with available data at each timepoint. *Indicate statistically significant difference compared to baseline; p < .05.
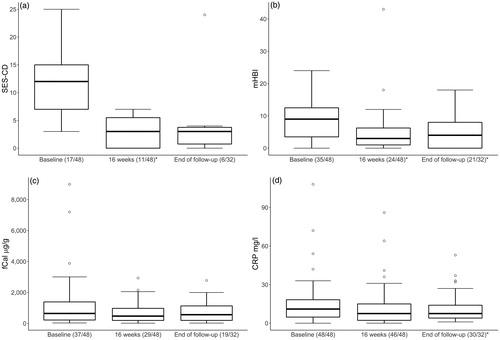
Table 3. Clinical parameters during the study follow-up among UST users: median, (IQR, 25th–75th percentile).
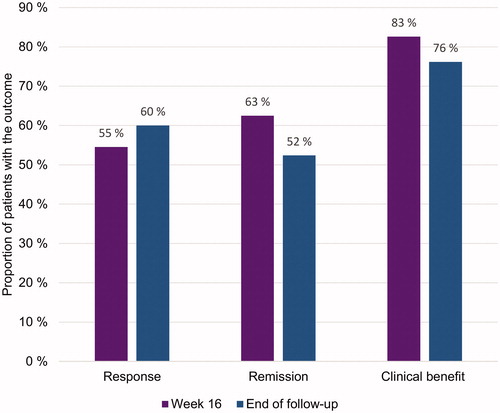
Figure 6. Proportion of ustekinumab treated Crohn’s disease patients with response, remission and clinical benefit at week 16 and at end of follow-up.