Figures & data
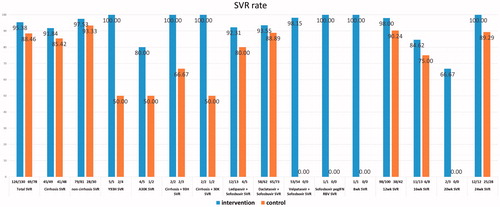
Figure 1. Flowchart of patients included in the study. Baseline resistance testing in the control group was performed retrospectively.
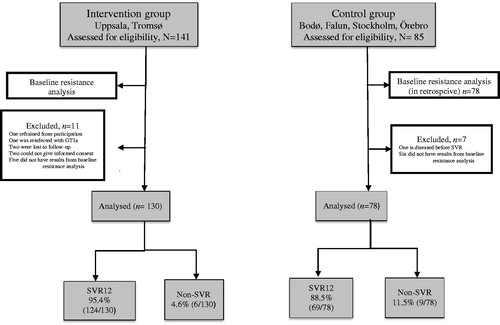
Table 1. Genotype 3 patient baseline characteristics.
Table 2. Treatment characteristics of the GT3 patients.
Table 3. Clinical and treatment characteristics in patients with baseline A30K and Y93H RASs.
Table 4. Clinical characteristics, baseline, and emerging NS5A RASs in the non-SVR patients.
Figure 2. Sustained virologic response rates (SVR) in the intervention and control groups. Treatment period for the intervention group was from 2 October 2014 to 5 December 2017, and for the control group from 10 April 2014 to 17 November 2016. SVR rates in the intervention group (blue bars) and the control group (orange bars).