Figures & data
Figure 1. Reduction of Harvey-Bradshaw index (left) and partial Mayo clinic score (right) in response to infliximab induction treatment.
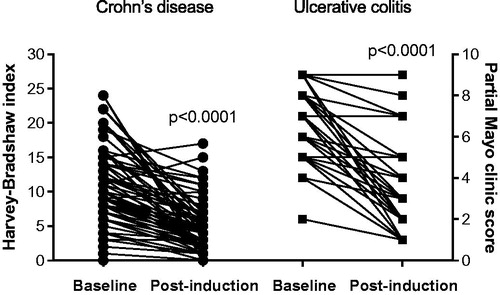
Figure 2. Fecal calprotectin (top) and serum C-reactive protein (bottom) values before and after infliximab induction treatment.
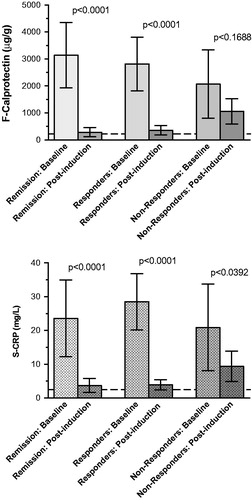
Table 1. Estimated clinical indices of Crohn’s disease with Harvey–Bradshaw index and ulcerative colitis with partial Mayo clinic sore, fecal calprotectin and serum C-reactive protein.
Table 2. Cytokine and chemokine array of plasma samples from representative responders to infliximab treatment.
Figure 3. Comparison of fecal calprotectin (top) and serum C-reactive protein (bottom) values before and after infliximab induction treatment without and with the addition of azathioprine as immunosuppressant.
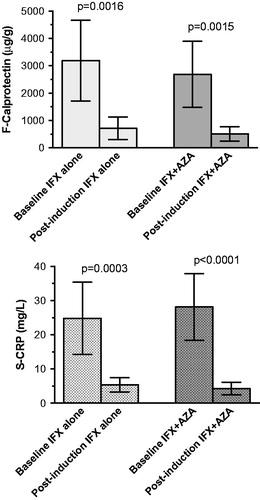
Figure 4. Receiver operating characteristics curves of fecal calprotectin (top) and serum C-reactive protein (bottom).
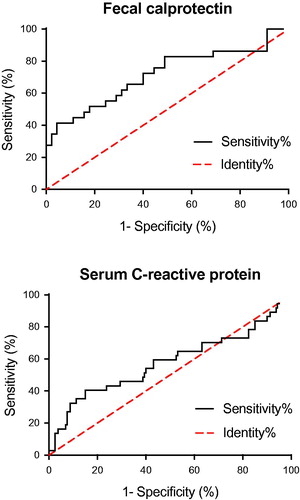
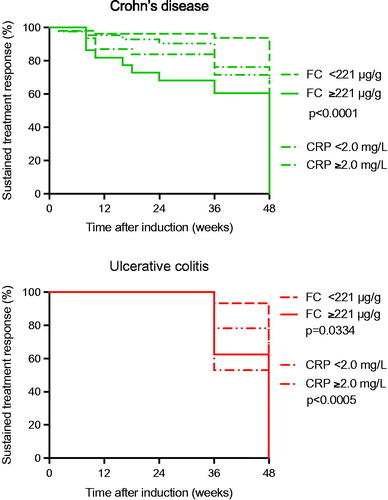
Figure 5. Kaplan–Meier survival analysis of the biomarkers fecal calprotectin and serum C-reactive protein as discriminative biomarker in Crohn’s disease (top) and ulcerative colitis (bottom). In Crohn’s disease the optimized cutoff value of fecal calprotectin 221 μg/g was associated with a treatment ‘incident’ within 48 weeks after infliximab induction treatment (p < .0001), whereas the corresponding optimized C-reactive protein cutoff 2.1 mg/L was not. In ulcerative colitis the optimized cutoff value of fecal calprotectin 221 μg/g was associated with a treatment ‘incident’ within 48 weeks after infliximab induction treatment (p < .0005), as was the corresponding optimized C-reactive protein cutoff level at 2.1 mg/L (p = .0334).