Figures & data
Table 1. Demographics and clinical characteristics of all patients with ulcerative colitis and Crohn’s disease, stratified by relapse during the study period.
Figure 1. Serial faecal EDN- and ECP measurements (µg/g) in patients with ulcerative colitis: time 0 refers to the time of relapse or end of study period. Data is shown as bars corresponding to interquartile range (IQR), separate for patients who experienced a relapse (black) and patients who remained in sustained remission (grey). Median values are marked with a black horizontal line. *p < .05 for comparison.
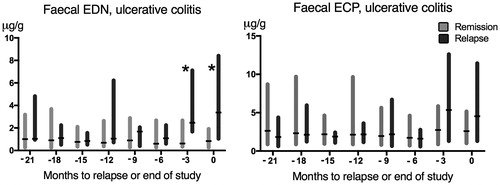
Table 2. Median (IQR) concentrations for ulcerative colitis patients in relapse vs. remission. Results are presented for time 0 (relapse/end of study) and -3 (three months prior). The difference between concentrations in relapse vs. remission groups was only significant for EDN.
Table 3. Information from extended Cox regression on predictors of clinical relapse in patients with ulcerative colitis analysed by Model A, including time-variant faecal EDN, age, and sex; and Model B, including time-variant faecal EDN, age, sex, and treatment factors as a sensitivity analysis.
Figure 2. Serial faecal EDN-measurements and ECP-measurements (µg/g) in patients with Crohn’s disease: time 0 refers to the time of relapse or end of study period. Data is shown as bars corresponding to interquartile range (IQR), separate for patients who experienced a relapse (black) and patients who remained in sustained remission (grey). Median values are marked with a black horizontal line.
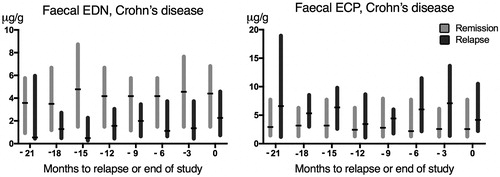
Table 4. Median (IQR) concentrations of EDN and ECP in Crohn's disease: relapse versus remission. Results are presented at time 0 (relapse/end of study) and -3 (three months prior).
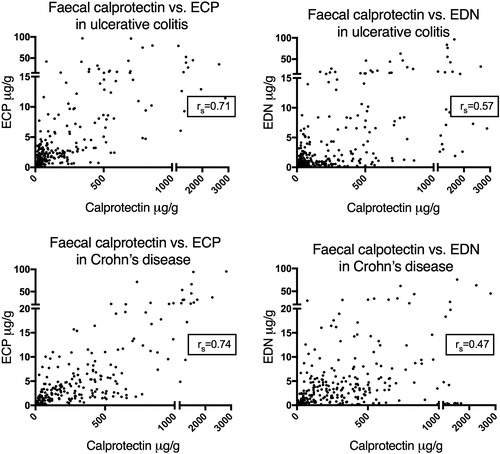
Table 5. Spearman’s rank correlation coefficients (rs) for ECP, EDN and faecal calprotectin (FC). Results for all patients in the disease groups, and stratified by relapse during the study period. All results were significant (p < .001) except those marked with ‘†’.
Figure 3. Correlation between faecal calprotectin and ECP/EDN in patents with ulcerative colitis (top) and Crohn's disease (bottom). p < .05 for all rs (Spearman’s rank correlation coefficient). Note, broken axis in graphs.