Figures & data
Figure 1. Pedigree showing the kindred with autosomal familial intestinal degenerative neuropathy (FIDN) with indications of clinical and genetic features. Filled symbols indicate chronic gut symptoms. Genetically tested subjects have coloured symbols: Red = Ch9 duplication; Green = no Ch9 duplication.
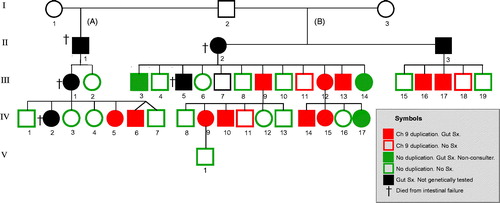
Figure 2. Mapping of a common disease haplotype among affected subjects in the large pedigree (). Genome wide analysis of all affected individuals from the family were analysed using the RFI model (region free of incompatibilities). SNP loci (using Affymetrix arrays with 262,000 individual SNPs) were grouped into 2620 groups of 100 consecutive loci. Regions with 100 consecutive loci showing three or more incompatibilities are shown as a red box in the chromosome plot. No incompatibilities in the group of 100 loci is indicated by a green horizontal box in the chromosome plot. Note that a region on chromosome region 9p showed a strong indication of a haplotype shared by the affected members of the family, thus indicating a common ancestral founder disease haplotype and a mutation. The common ancestral region on chromosome 9 constitute region 13.83 Mb–23.57 Mb from pter (9.74 Mb; 45 protein coding genes).
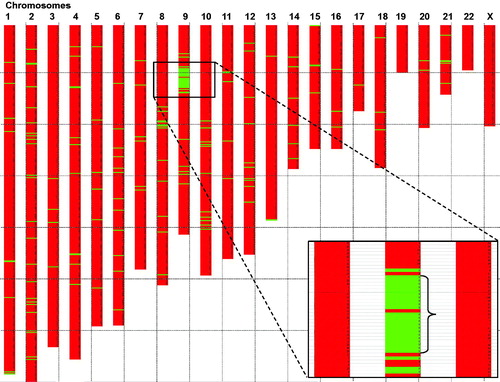
Figure 3. Analysis of SNP array genome profile showed that affected family members in addition to the 9.74 Mb region described in , have a 1.2 Mb duplication in the region 20.9–22.1 Mb from pter.
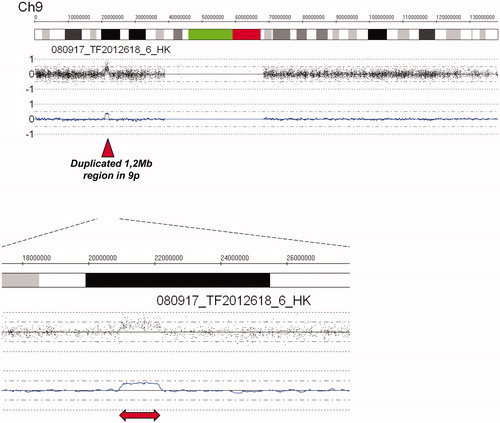
Figure 4. Detailed map of all denoted genes in the 9.7 Mb region of common ancestry and the 1.2 Mb region of duplication. Thus, 22 protein coding genes are within the duplicated gene region. Based on the extension of the duplicated region, one gene, the FOCAD gene (Focadhesin; HGNC: 23377), is predicted to be disrupted by one of the newly introduced breakpoints.
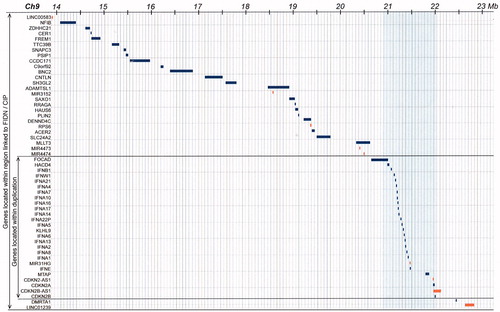
Table 1. Gastrointestinal symptoms and CIP in 33 family members with or without the 1.2 Mb duplication in chromosome 9 at genetic testing.
Table 2. The 26 duplicated genes (of which 22 are protein coding) in the 1.2 Mb duplication in Ch9 linked to FIDN [dup(9)(p21.3)].
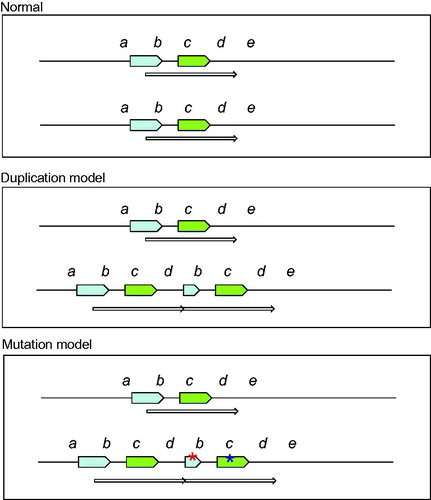
Figure 5. Tentative model of the chromosome region 9p, 1.2 Mb duplication. The green arrow represents the genes that are duplicated and thus present in 3 copies instead of the normal 2 copies. They include e.g., a group of interferon genes and the tumour suppressor genes CDKN2A/CDKN2B. The blue arrow represents the disrupted FOCAD gene where the 3’-end is present in three copies while the 5’-end is present in normal two copies.