
Figures & data
Table 1. Study population characteristics.
Table 2. The relation between hemodynamic measurements and reported GI symptoms.
Table 3. Spearman’s correlation between office measurement of hemodynamic parameters and specific symptoms.
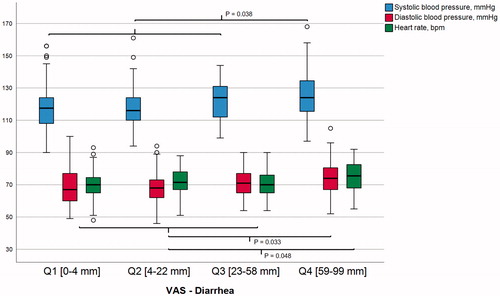
Figure 1. The relationship between the severity of diarrhea and 24-hour hemodynamic measurements. The reported severity of diarrhea among subjects with gastrointestinal symptoms (n = 509) in relation to 24-hour systolic blood pressure (blue bars), diastolic blood pressure and heart rate . P-values indicate significance in mean differences between VAS diarrhea quartile four and combined quartiles one to three, using linear regression including age, sex, smoking and self-reported chronic stress as covariates. Q: quartile; VAS: visual analogue scale; bpm: beats per minute.
Supplemental Material
Download PDF (110.7 KB)Supplemental Material
Download MS Word (13.2 KB)Data availability
All data can be obtained from the authors upon request.