
Figures & data
Figure 1. Enrolment in the study between April 2015 and November 2016. Included patients were approached with information about the interviews by letter (n = 25), at the clinic (n = 10) or by telephone (n = 7).
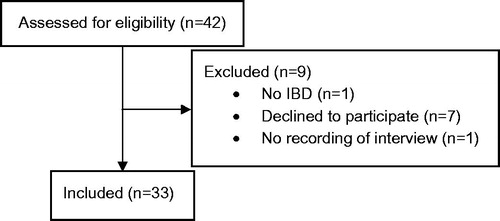
Table 1. Clinical characteristics and demographic of included patients (n = 33).
Table 2. Example quotations from interviews to clarify themes and subthemes.