
Figures & data
Figure 1. Study flow chart.
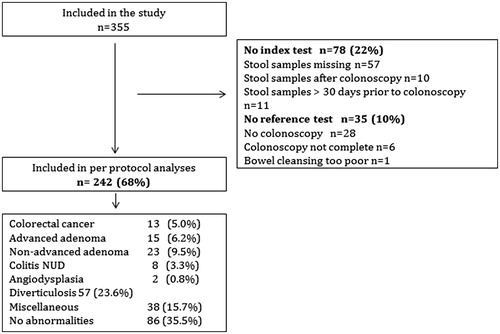
Table 1. Basic characteristics of patients in the analyses (n = 242).
Table 2. Reported symptoms and positive predictive value (PPV) for colorectal cancer among patients referred for colonoscopy (n = 242).
Table 3. Faecal haemoglobin concentrations (µg Hb/g) of one FIT and max value/2 FITs by colonoscopy findings. Values in parenthesis are row percentages.
Table 4. Accuracy and predictive values for colorectal cancer of one FIT and max value/2 FITs at cut-off 10, 15 and 20 µg Hb/g.
Figure 2. (a) ROC curve for one FIT; (b) ROC curve for maximum value/2 FITs.
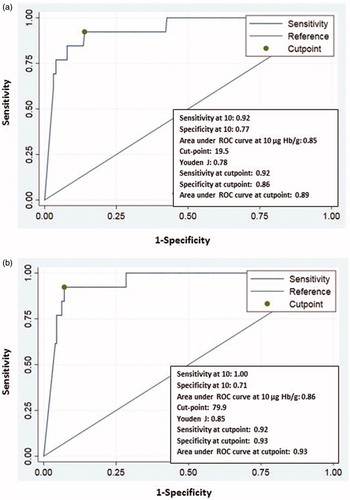
Table 5. Estimated odds ratio for colorectal cancer of uni- and multivariate analyses (n = 242).