Figures & data
Table 1. Baseline characteristics in ulcerative colitis in clinical remission, active and in normal controls.
Figure 1. Volcano plot demonstrating differentially regulated genes between clinical remission and normal controls when adjusted for age, gender, endoscopic score and Geboes score. *TBX21 is analyzed with a nonparametric method (Mann–Whitney U-test). Genes analyzed with hydrolysis probe. All named genes are significant (<.05) and genes on the left-side are down-regulated, conversely, genes on the right-side are up-regulated.
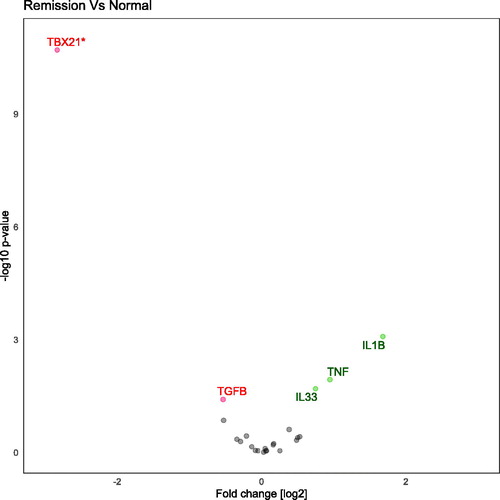
Figure 2. Volcano plot demonstrating differentially regulated genes when comparing Ulcerative colitis in clinical remission to normal controls. Genes are analyzed with SYBR-green and are adjusted for age and gender. Genes on the left-side are down-regulated and genes on the right-side are up-regulated.
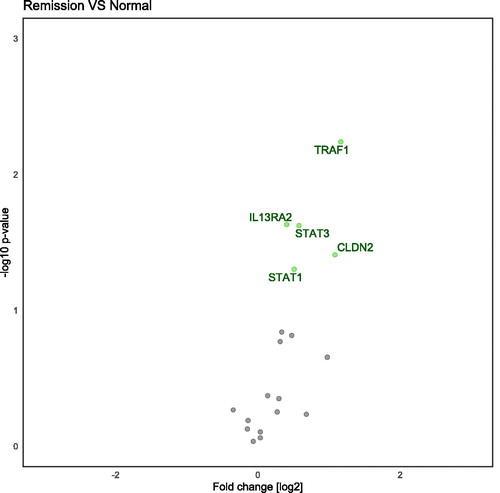
Figure 3. Volcano plot demonstrating differentially regulated genes when comparing active Ulcerative colitis to normal controls. Genes are analyzed with SYBR-green and are adjusted for age and gender. Genes on the left-side are down-regulated and genes on the right-side are up-regulated.
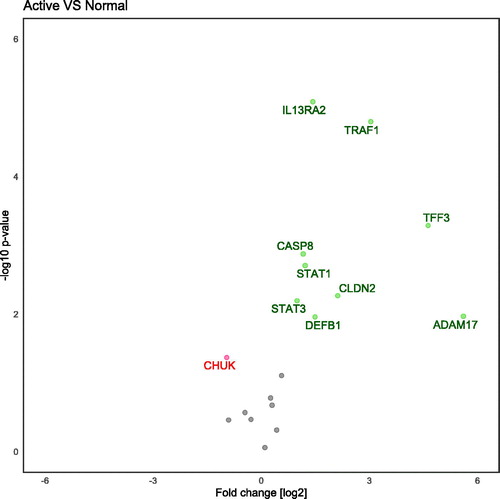
Table 2. All tested genes by the analysis method.
Table 3. Hydrolysis probes results are adjusted for age, gender, endoscopic subscore and Geboes score. SYBR-green results are adjusted for age and gender.
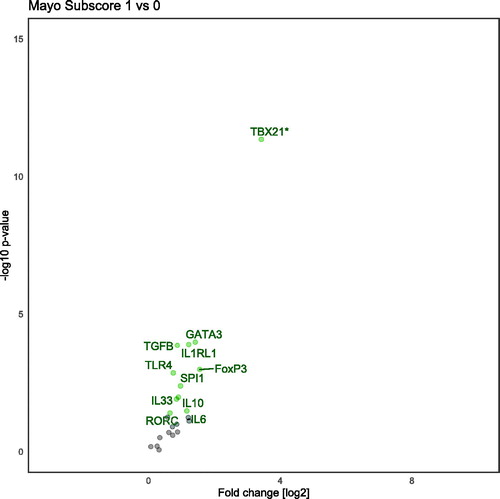
Figure 4. Volcano plot demonstrating differently translated genes between mayo endoscopic score 0 and 1. Analyzed with hydrolysis probe. Several transcription factors for T-cell development are up-regulated.