Figures & data
Table 1. Classification of geographical regions in Sweden.
Figure 1. Age-standardised incidence rate of oesophageal cancer by sex and histological type for each national area in Sweden in 1972–2016. (a) adenocarcinoma in men; (b) adenocarcinoma in women; (c) squamous cell carcinoma in men; (d) squamous cell carcinoma in women.
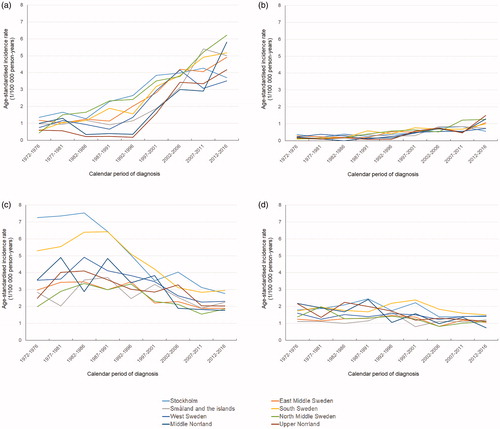
Figure 2. County-specific age-standardised incidence rate (per 100,000 person-years) of (a) oesophageal adenocarcinoma and (b) oesophageal squamous cell carcinoma in men in Sweden in 2002–2016. The stars indicate the locations of the specialised upper gastrointestinal oncology units.
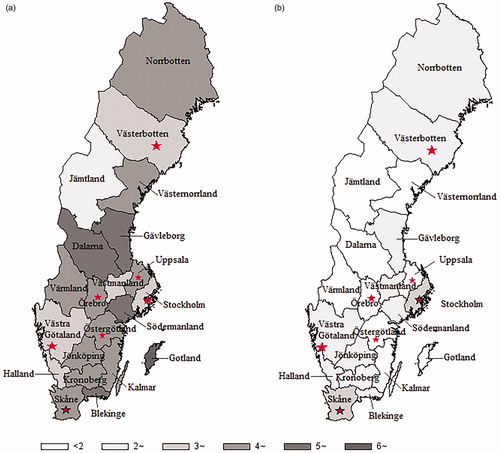
Table 2. Crude and age-standardised incidence rates of oesophageal adenocarcinoma by sex and calendar period for each county in Sweden, 1/100,000 person-years.
Table 3. Crude and age-standardised incidence rates of oesophageal squamous cell carcinoma by sex and calendar period for each county in Sweden, 1/100,000 person-years.
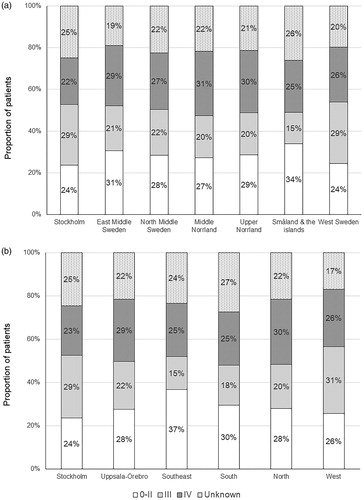
Figure 3. Distribution of oesophageal cancer patients diagnosed at different tumour stages (a) by national area and (b) by healthcare region in Sweden in 2004–2016.