
Figures & data
Table 1. Baseline characteristics of patients diagnosed with primary hepatocellular carcinoma in Sweden in 2006 to 2014 by β-blocker use at cancer diagnosis.
Figure 1. Age-adjusted liver cancer survival curves by β-blocker use among patients with primary hepatocellular carcinoma diagnosed in 2006 to 2014 in Sweden. Survival curves were estimated using flexible parametric survival analysis. The adjusted curves show the survival we would expect to see in exposure groups if each had the age distribution of the study population as a whole (to compare like with like). Values on the plot are age-adjusted median survival estimates by β-blocker use.
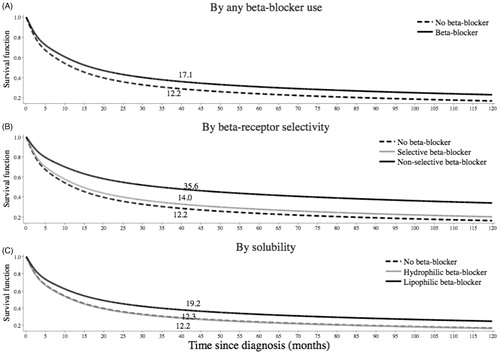
Table 2. Cox proportional hazards regression analyses for the association between β-blocker use and liver cancer mortality in patients diagnosed with primary hepatocellular carcinoma (N = 2104) in Sweden in 2006–2014.
Table 3. Cox proportional hazards regression analyses for the association between selected β-blockers and liver cancer mortality in patients diagnosed with primary hepatocellular carcinoma (N = 2104) in Sweden in 2006–2014.
Table 4. Cox proportional hazards regression analyses for the association between antihypertensive medications and liver cancer mortality in patients diagnosed with primary hepatocellular carcinoma in Sweden between 1 July 2006 and 31 December 2014 (N = 1479).