
Figures & data
Figure 1. Observation period.
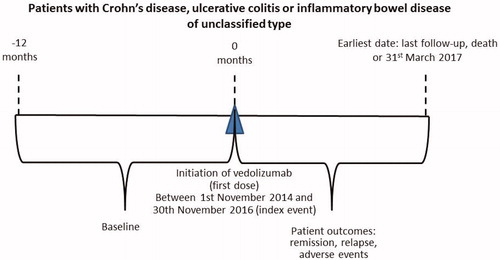
Table 1. Patient demographics.
Table 2. Treatment history.
Figure 2. Kaplan-Meier plot of time to corticosteroid-free remission.
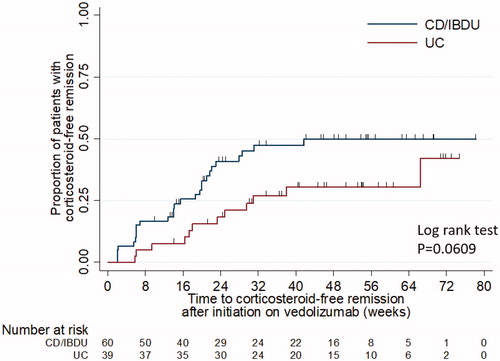
Figure 3. Kaplan-Meier plot of time to first clinical remission.
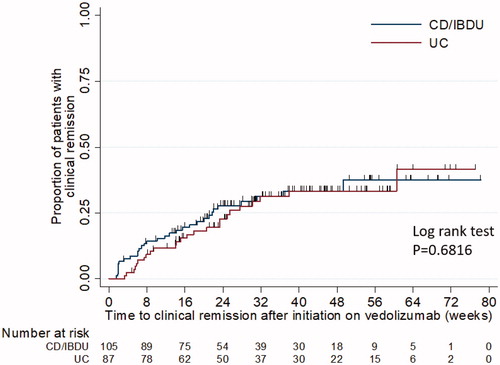
Figure 4. Kaplan-Meier plot of time to corticosteroid-free remission according to exposure to anti-TNF therapy for UC cohort only.
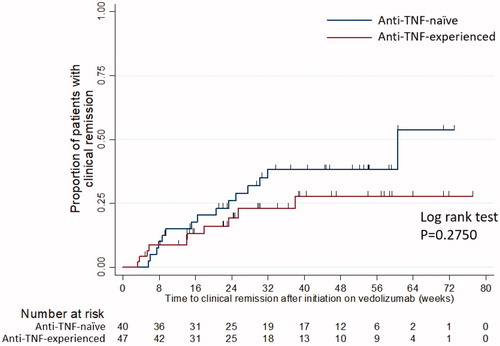
Table 3. Rates of remission and response to vedolizumab achieved during observation period.
Table 4. Distribution of adverse events in patients receiving vedolizumab.