
Figures & data
Table 1. Clinical characteristics of twins with inflammatory bowel disease.
Figure 1. The median concentration (IQR) of faecal EDN and ECP in twins with Crohn’s disease and ulcerative colitis, their healthy siblings and external controls. EDN and ECP concentrations between groups were compared using a regression analysis of a mixed-model design, significances are shown with staples (*0.01< p ≤ .05, **.001< p ≤ .01, ***p ≤ .001).
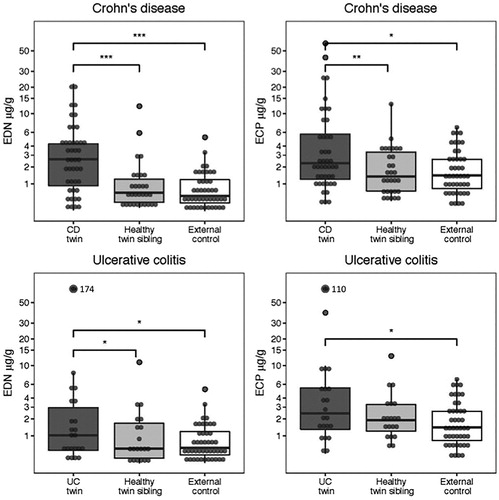
Table 2. The ratio of EDN and ECP respectively between different selected groups of twins and healthy controls. To compare EDN and ECP, a regression analysis of a mixed-model design was used and a ratio related to geometric means (Ratio) with 95% confidence interval (95% CI) was calculated.
Table 3. Intraclass correlation coefficient for concentrations (elogarithm) of EDN and ECP in different groups of twins.
Figure 2. Immunohistochemical identification of eosinophils with EPO in rectal biopsies from: (a) twin with active Crohn’s disease, (b) healthy sibling among pair discordant for Crohn’s disease, (c) twin with active ulcerative colitis, (d) healthy sibling among pair discordant for ulcerative colitis
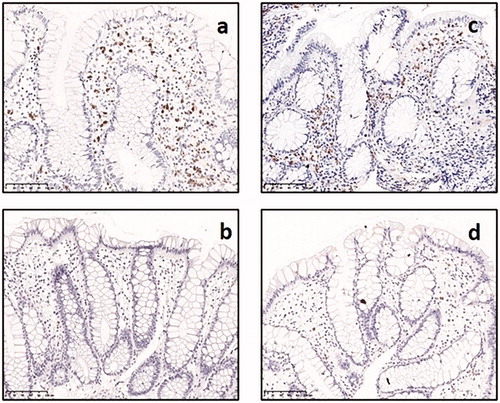
Table 4. The ratio of eosinophils counts defined as elogarithm (median) in rectal biopsies, identified by immunohistochemical staining, between different selected groups of twins. To compare eosinophil counts, a regression analysis of a mixed-model design was used and a ratio related to geometric means (Ratio) with 95% confidence interval (95% CI) was calculated.