
Figures & data
Table 1. Outcomes used as a proxy of a flare or disease activity.
Table 2. Demographics, disease characteristics and nutritional predictors.
Table 3. Significant risk factors of inadequate nutritional intakeduring the inpatient period, (n = 91).
Figure 1. Kaplan Meier curves on steroid free survival in patients with respect to number of days inadequate energy intake. (a) The upper panel shows survival curves for patients with no days with energy intake under 30% of calculated requirement and in patients with at least one day with energy intake under 30% of calculated requirement. Difference between survival is statistically significant with p < 0.03. Curves are adjusted for age and sex. The table under the Kaplan Meier curves shows numbers at risk in each category at respective time points. (b) The lower panel shows survival curves for patients with 0, 1, 2 to 3 and 4 or more days with energy intake under 70% of calculated requirement. Differences between curves for patients with 0 days and patients with 1, 2 to 3 or 4 or more days with energy intake under 70% of calculated requirement are not statistically significant (p = 0.6, 0.4, and 0.1 respectively). Curves are adjusted for age and sex. The table under the Kaplan Meier curves shows numbers at risk in each category at respective time points.
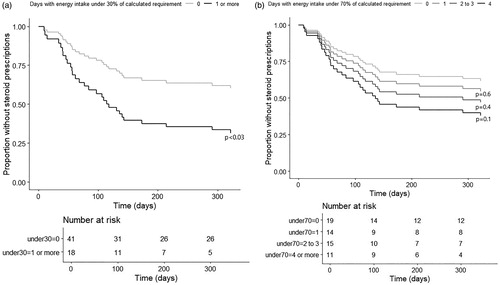
Table 4. Factors significantly associated with disease course.