Figures & data
Table 1. Data and sample collection throughout the course of the study.
Table 2. Exclusion criteria of FMT donors.
Table 3. Overview of patient characteristics and study outcomes throughout the study.
Table 4. Concomitant medications (until 12 weeks).
Table 5. Adverse events after FMT.
Figure 1. Number of stools after FMT. a–c Number of stools per day of patients with active disease at baseline. d–f Number of stools per day of patients in remission at baseline. These patients were in remission also after FMT. The missing/excluded values of some patients during the later time points were replaced with the individual baseline values when performing the statistical tests. No statistically significant differences were found. Open symbols show clinical responders, dashed lines show patients who were already in remission at baseline.
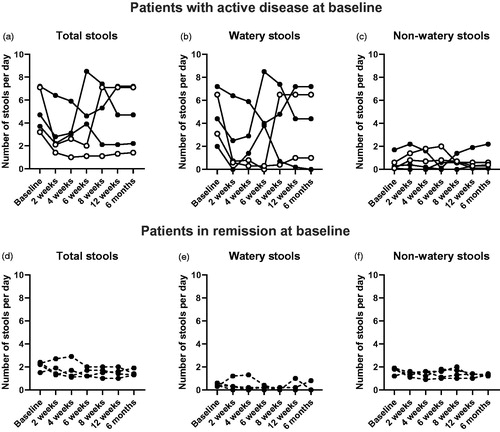
Figure 2. Gastrointestinal symptom rating scale scores before and after FMT. * indicates p < .05, ** indicates p < .01 compared to baseline when adopting a conservative approach. The missing/excluded values of some patients during the later time points were replaced with the individual baseline values when performing the statistical tests. Open symbols show clinical responders, dashed lines show patients who were already in remission at baseline.
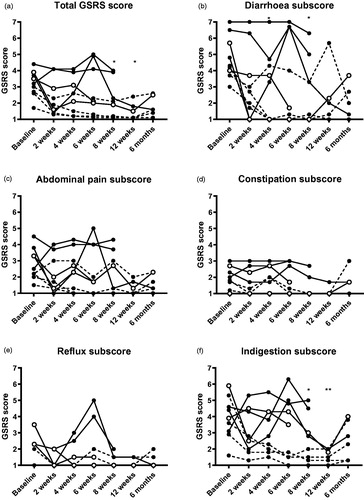
Figure 3. Hospital anxiety and depression scale scores before and after FMT. No statistically significant differences were found. The missing/excluded values of some patients during the later time points were replaced with the individual baseline values when performing the statistical tests. Open symbols show the clinical responders, dashed lines show patients who were already in remission at baseline.
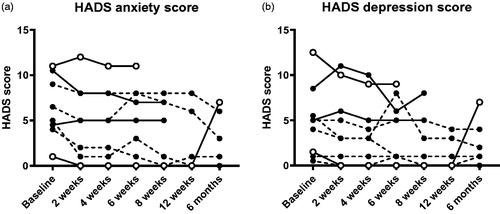
Table 6. Short health scale questionnaire before and after FMT.
Figure 4. EQ-5D-5L scores before and after FMT. ** indicates p < .01 compared to baseline when adopting a conservative approach. The missing/excluded values of some patients during the later time points were replaced with the individual baseline values when performing the statistical tests. Open symbols show the clinical responders, dashed lines show patients who were already in remission at baseline.
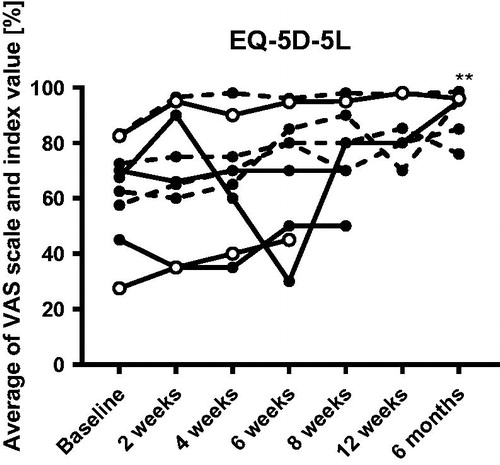
Figure 5. Maximal collagen layer thickness (a) and number of intraepithelial lymphocytes (IELs) (b) in distal colonic biopsies at baseline and six weeks. Open symbols show the clinical responders, dashed lines show patients who were already in remission at baseline.
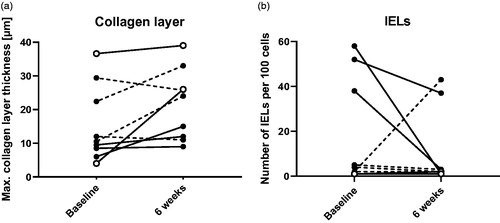
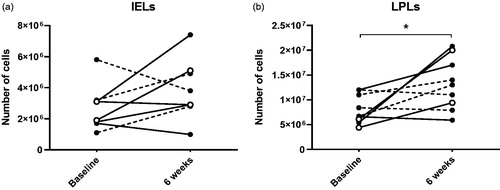
Figure 6. Cell counts after isolation of intraepithelial lymphocytes (IELs) (a) and lamina propria lymphocytes (LPLs) (b) from colonic biopsies at baseline and six weeks. * indicates p < .05. Open symbols show the clinical responders, dashed lines show patients who were already in remission at baseline.