
Figures & data
Figure 1. Flow chart that show how the patients were recruited for the study.
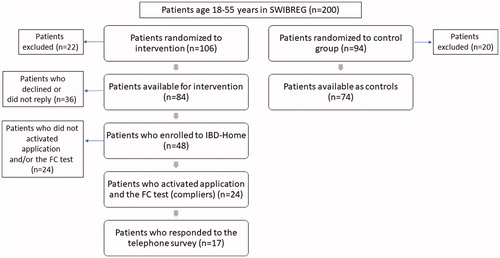
Table 1. Questions at a telephone survey to compliers of IBD-Home.
Table 2. Baseline demographics and characteristics of patients at inclusion.
Table 3. Factors associated with adherence to the IBD-Home model in the patients randomized to IBD-Home. Logistic regression.
Figure 2. The total number of Bühlmann HBFCT IBDoc® per patient for the patients in the intervention group who were compliant to the IBD-model.
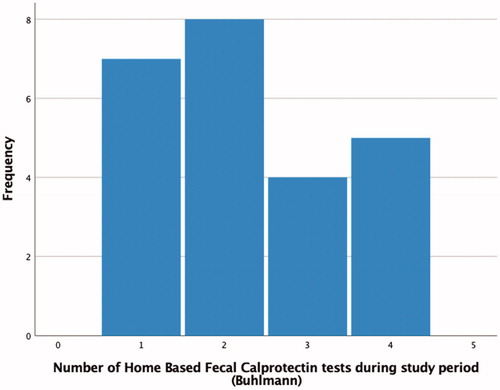
Figure 3. The total number of tests (both Bühlmann HBFCT IBDoc® and CALPRO®) per patient in the intervention group (IBD-home model) and in the control group.
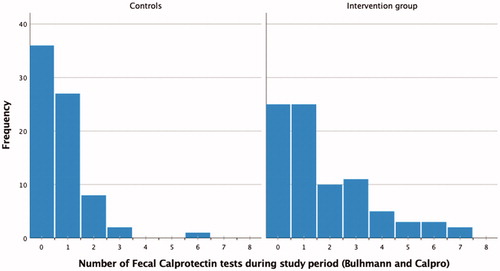
Table 4. Healthcare interactions and change in medical treatment during study.
Table 5. Factors associated with increased medical treatment in the IBD-Home group.