
Figures & data
Figure 1. The D3-dissection. The figure depicts the radicality of the central dissection. (A) After opening the left side of the mesentery along a line following the medial border of the superior mesenteric artery (SMA), the surgeon opens the artery's vascular sheath. Dissecting toward the right in the well-defined plane between the vessels and their sheaths, the surgeon lifts the anterior flap. Here we see that the ileocolic artery (ICA) crosses the superior mesenteric vein in the front. (B) Now, the ICA and the ileocolic vein are ligated and divided at their origins. SMV is carefully pulled to the left as the posterior flap is dissected out from behind the SMA, still in the plane between the artery and the vascular sheath. The dorsal delimitation of this flap is Toldt’s fascia. (C) Pictures the specimen with the vascular groove and the inner surface of the two flaps. (D) Depicts the mesentery, the two flaps, and the vascular groove from another angle.
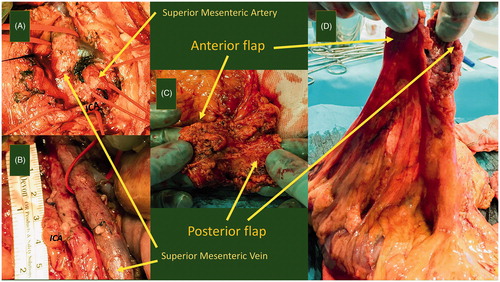
Figure 2. (A) The graphs depict the stool trends during the first 60 d after right colectomy with a traditional D2-mesenterectomy using a 3-points moving average. The graphs represent the total number of stools per day, as well as the number of formed, loose and watery stools per day. (B) The graphs depict the stool trends during the first 60 d after right colectomy with extended D3-mesenterectomy using a 3-points moving average. The graphs represent the total number of stools per day, as well as the number of formed, loose, and watery stools per day.
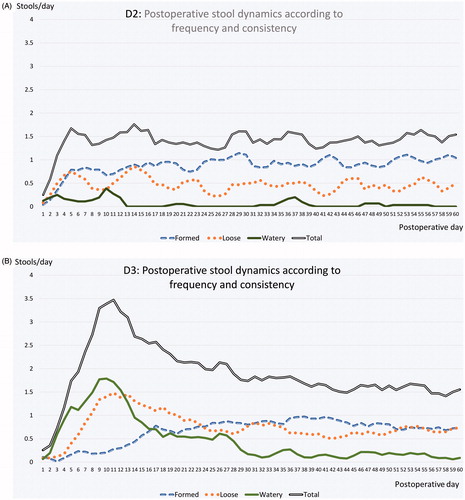
Table 1. Postoperative scores (after recovery) in the groups (D2/D3), differences between the groups without and with control for preoperative scores