
Figures & data
Figure 1. The geographical areas of inclusion of patients to the population-based inception cohort studies (a) IBSEN, recruited from the counties of Oslo, Østfold, Telemark and Aust-Agder during 1990–1994, and (b) IBSEN III, recruited from the counties of Agder (previously Aust-Agder and Vest-Agder), Innlandet (previously Oppland and Hedmark), Oslo, Vestfold and Telemark, and Viken (previously Buskerud, Akershus and Østfold), corresponding to the South-Eastern Health Region of Norway, during 2017–2019.
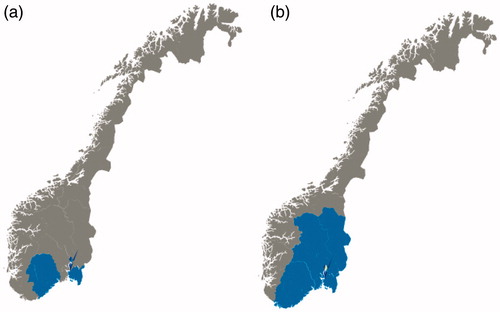
Table 1. Overview of data and biologic material collected in the IBSEN III study.
Table 2. Overview of National registries and databases to be linked with the IBSEN III study.
Figure 2. Flow chart of patients included in the study. Diagnosis of inflammatory bowel disease was set based on Lennard-Jones criteria for adults [Citation14] and Porto criteria for children [Citation15].
![Figure 2. Flow chart of patients included in the study. Diagnosis of inflammatory bowel disease was set based on Lennard-Jones criteria for adults [Citation14] and Porto criteria for children [Citation15].](/cms/asset/eccb34de-3105-47c0-93ea-93f4357484d8/igas_a_1922746_f0002_c.jpg)
Figure 3. Number of included patients during the study period, from each center and total inclusion rate.
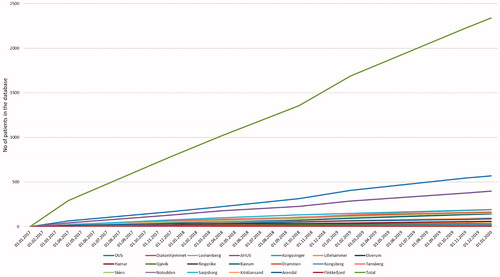
Table 3. Baseline characteristics of patients included in the IBSEN III cohort study.
Table 4. Overview of collected biobank material at baseline.
Supplemental Material
Download PDF (467.9 KB)Data availability statement
The data underlying this article cannot be shared publicly due to the privacy of individuals that participated in the study. The data will be shared on reasonable request to the corresponding author.