
Figures & data
Table 1. Baseline characteristics of the 279 patients included in the study.
Figure 1. Signal-to-cutoff (S/CO) antibody ratio in relation to the absence of IFN-λ4 (IFNL4rs12979860 CC) or presence of IFN-λ4 (IFNL4rs12979860 CT/TT) (A), gender (B), and gender and IFN-λ4 (C). Median and interquartile range. Statistics using Mann–Whitney U test.
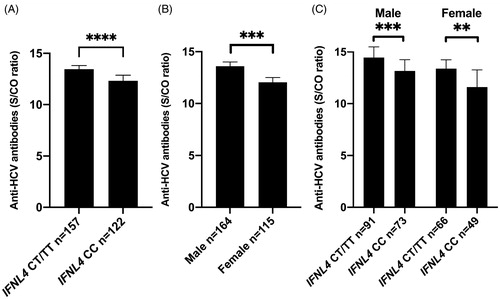
Figure 2. Signal-to-cutoff (S/CO) antibody ratio in anti-HCV antibody assay in relation to absent/mild or moderate/severe interface hepatitis (Ishak grade 0–2 versus 3–4) (A), and absent/mild or moderate/severe steatosis (grade 0–1 versus 2–3) (B). Median and interquartile range. Statistics using Mann-Whitney U-test.
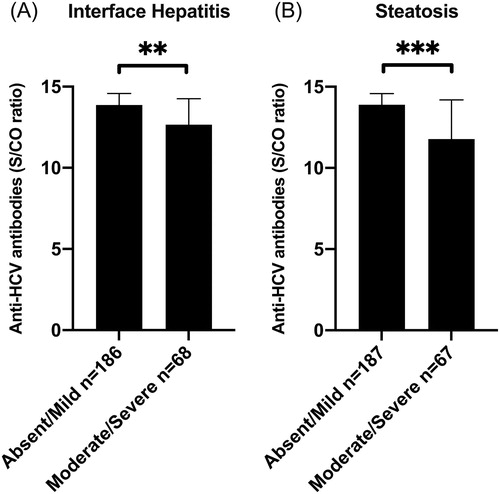
Table 2. Associations of baseline characteristics with anti-HCV S/CO ratio.