
Figures & data
Table 1. Participant characteristics and gastrointestinal (GI) symptoms the previous week.
Figure 1. Celiac Symptom Index (CSI, total score range 16-80), n = 3834. QoL, quality of life. Score ≤30 is associated with high QoL and excellent gluten-free diet adherence, score ≥45 is associated with relatively poor QoL and worse gluten-free diet adherence and score 31–44 is associated with moderately reduced QoL.
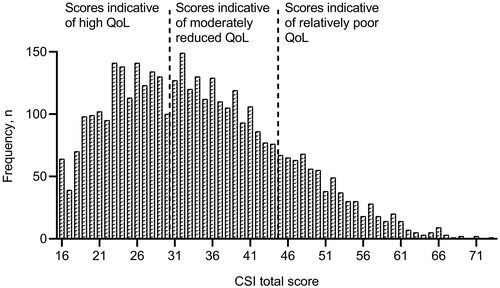
Table 2. Coeliac disease adherence test (CDAT) and self-reported adherence to a gluten-free diet, by GI symptoms the previous week, n = 3834.
Table 3. Mean (standard deviation, SD) per sub-dimension of gastrointestinal symptom rating scale-irritable bowel syndrome version (GSRS-IBS), and frequencies (%) of moderate to severe discomfort (GSRS-IBS ≥4), n = 2057.
Table 4. Simple linear regression (univariable) and multiple regression (multivariable) analysis for the association between GSRS-IBS and listed variables.