
Figures & data
Table 1. Baseline characteristics and follow-up differences by fatty liver index (FLI) and hypertension (HTN).
Table 2. Hazard ratios (HRs) of FLD and hypertension for mortality and cardiovascular outcomes in the study population (n = 1569).
Figure 1. Fully adjusted hazard ratios (HRs) with 95% CIs for all-cause mortality, cardiovascular mortality and non-cardiovascular mortality stratified by fatty liver index and hypertension categories. FLD: fatty liver disease; FLI: fatty liver index.
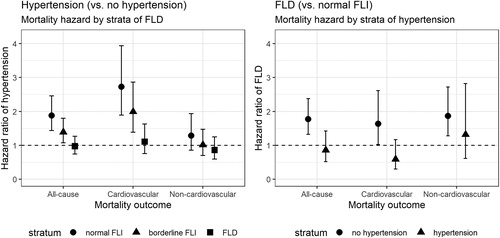
Table 3. Estimates of the biological interaction of fatty liver disease and hypertension on mortality and cardiovascular outcomes.
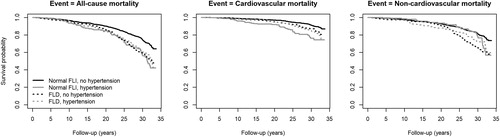
Figure 2. Fully adjusted survival curves for all-cause mortality, cardiovascular mortality and non-cardiovascular mortality. FLI: fatty liver index.
Supplemental Material
Download TIFF Image (7.7 MB)Supplemental Material
Download TIFF Image (9.3 MB)Supplemental Material
Download MS Word (22.9 KB)Supplemental Material
Download PDF (286.8 KB)Supplemental Material
Download MS Word (27.3 KB)Data availability statement
The University of Eastern Finland can be approached for requests of access to the KIHD dataset.