
Figures & data
Table 1. Incident inflammatory bowel disease (IBD) cases per year from 2010 to 2016 stratified by diagnosis.
Table 2. Proportion of patients initiating biologics within 12 months after diagnosis stratified by year of diagnosis.
Figure 1. (a) Kaplan–Meier failure estimate of time from diagnosis to first biologic stratified by year of diagnosis for CD patients. The Y axis shows the cumulative probability of initiating biologics. The X axis shows development over time in months. (b) Kaplan–Meier failure estimate of time from diagnosis to first biologic stratified by year of diagnosis for UC patients. The Y axis shows the cumulative probability of initiating biologics. The X axis shows development over time in months.
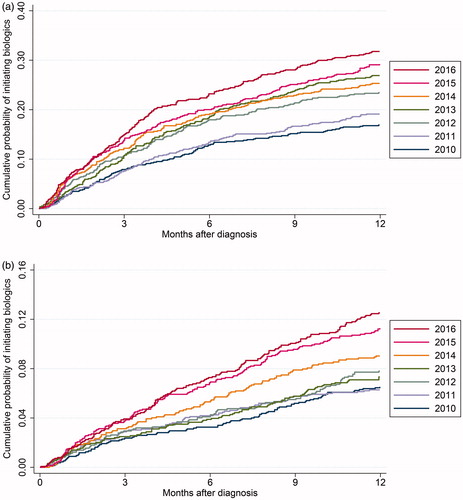
Table 3. The use of first-line biologics stratified by diagnosis and year of diagnosis.
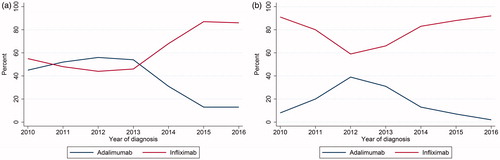
Figure 2. (a) First-line biologic for CD patients initiating biologics stratified by infliximab and adalimumab as first biologic registration. Y axis shows percent of biologic recipients started on either infliximab or adalimumab. X axis shows yearly cohorts from 2010 to 2016. (b) First-line biologic for UC patients initiating biologics stratified by infliximab and adalimumab as first biologic registration. Y axis shows percent of biologic recipients started on either infliximab or adalimumab. X axis shows yearly cohorts from 2010 to 2016.
Supplemental Material
Download PDF (129.6 KB)Data availability statement
The data underlying this article were provided by the Norwegian National patient register (NPR) and the Norwegian Prescription Database (Nor-PD) by permission. Data cannot be shared publicly due to the privacy of the patients listed in the registries. Data are available from the NPR (https://www.helsedirektoratet.no/tema/statistikk-registre-og-rapporter/helsedata-og-helseregistre/norsk-pasientregister-npr) and Nor-PD (http://www.reseptregisteret.no/) through an application process.