
Figures & data
Table 1. Clinical characteristics of patients with Crohn’s disease (CD) and ulcerative colitis (UC).
Table 2. Comparisons of fold change ratio of serum perfluoroalkyl substances (PFAS) concentration in ulcerative colitis (UC), Crohn’s disease (CD) and healthy controls (HC) with adjusted p-values.
Figure 1. The effect of ex vivo exposure to perfluorooctanoic acid (PFOA) on intestinal barrier function as measured by conductance, (A) ileal and (B) colonic conductance (G), macromolecular passage as assessed by FITC-dextran flux across (C) ileal mucosa and (D) colonic mucosa and stimulated secretory response to Charbachol, (E) ileal and (F) colonic short circuit current (Isc) after exposure to 10, 100 µM PFOA or vehicle (DMSO). N = 7–9. Data are presented as median with range (min/max), significance levels are calculated with Kurskal–Wallis and Mann–Whitney U-analysis, (*p < .05; **p < .01; ns: non-significant).
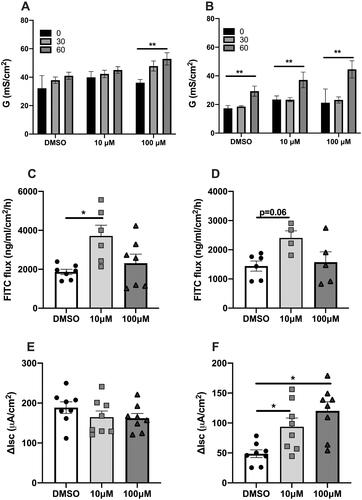
Figure 2. The distribution of individual bile acids (BAs) in ulcerative colitis (UC), Crohn’s disease (CD) and healthy controls (HC), grouped as primary conjugated (PRIM., CONJ.), primary free (PRIM., FREE), secondary conjugated (SEC., CONJ.), and secondary free (SEC., FREE).
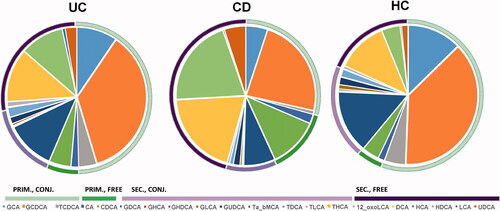
Table 3. Comparisons of fold change ratio of serum bile acids (BAs) concentration in ulcerative colitis (UC), Crohn’s disease (CD) and healthy controls (HC) with adjusted p-values.
Table 4. Differences in bile acid (BA) concentrations (ng/mL) in relation to Crohn’s disease location, according to Montreal classification.
Figure 3. Spearman correlations between perfluoroalkyl substances and bile acids in (A) ulcerative colitis (UC) (B) Crohn’s disease (CD) and (C) Healthy controls (HC). Only significant correlations (p < .05) are shown.
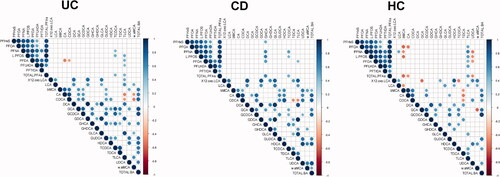
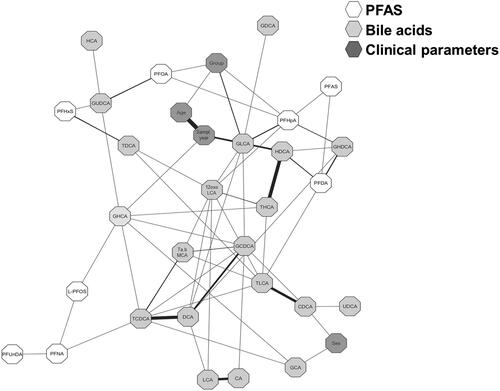
Figure 4. Partial correlation network projection, i.e., degree of association, of (1) clinical parameters: group (i.e., ulcerative colitis (UC), Crohn’s disease (CD) and healthy control (HC)), sampling year, age at sampling and sex, (2) perfluoroalkyl substances (PFAS), (3) primary bile acids (BAs), and (4) secondary BAs. Each node represents a compound (PFAS or BA) or a clinical parameter where each edge represents the strength of the partial correlation between two compounds and/or parameters after conditioning on all other compounds and parameters in the datasets. Edge weights represent the partial correlation coefficients, with black colour for negative correlations and gray colour for positive correlations, the thickness of the line shows the strength of the correlation. Edge ranges adjusted between ± 0.22 to 0.75.
Supplemental Material
Download MS Word (21.9 KB)Data availability statement
The data that support the findings of this study are available on request from the corresponding author, [IS], upon reasonable request.