
Figures & data
Figure 1. Flowchart of the study design.
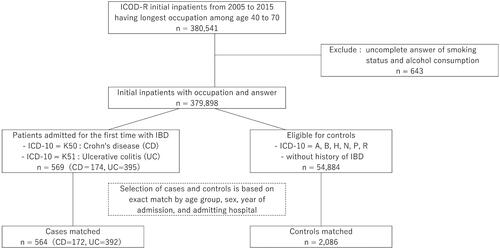
Table 1. Baseline characteristics of cases and controls.
Figure 2. Occupational risk of IBD, CD and UC by the longest-held occupational category. The odds ratios (ORs, sign: marker) and 95% confidence intervals (CIs, sign: bar) were estimated by conditional logistic regressions with multiple imputation, matched for age, sex, admission year, hospital, adjusted for smoking status and alcohol consumption. *The 95%CIs did not cross the 1.0 line.

Table 2. Odds ratios (ORs) and 95% confidence intervals (CIs) for IBD, CD and UC by the longest-held occupational category.
Table 3. Odds ratios (ORs) and 95% confidence intervals (CIs) for IBD, CD and UC by OPA levels.
Supplemental Material
Download PDF (82.5 KB)Data availability statement
The datasets are not publicly available due to restrictions used under the license for the current study. There are available on reasonable request from the corresponding author.